The importance of a good support level in a fast-moving currency trade
A sudden break in the euro's support level underlines how effective this method is for choosing entry and exit points to trades, says John C Burford.
Get the latest financial news, insights and expert analysis from our award-winning MoneyWeek team, to help you understand what really matters when it comes to your finances.
You are now subscribed
Your newsletter sign-up was successful
Want to add more newsletters?

Twice daily
MoneyWeek
Get the latest financial news, insights and expert analysis from our award-winning MoneyWeek team, to help you understand what really matters when it comes to your finances.

Four times a week
Look After My Bills
Sign up to our free money-saving newsletter, filled with the latest news and expert advice to help you find the best tips and deals for managing your bills. Start saving today!
In the markets, how quickly prices change!
No sooner had the ink dried on my last email on support and resistance in the currency markets, than the markets started moving in earnest.
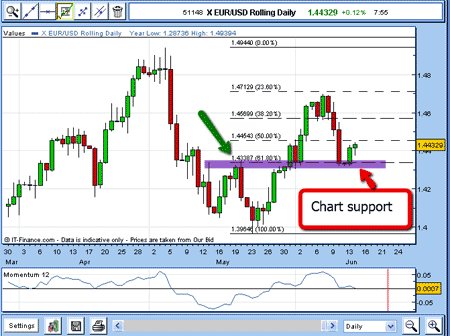
Recall, I had identified a chart support level at the 1.4330 level as of Monday:
MoneyWeek
Subscribe to MoneyWeek today and get your first six magazine issues absolutely FREE

Sign up to Money Morning
Don't miss the latest investment and personal finances news, market analysis, plus money-saving tips with our free twice-daily newsletter
Don't miss the latest investment and personal finances news, market analysis, plus money-saving tips with our free twice-daily newsletter

(Click on chart for a larger version)
And the market was, indeed, moving up off that support.
This was an ideal time to enter short positions (or add to existing trades) on that rally in anticipation of a break of that support.
Right after writing that piece, the market turned back down and crashed through the chart support. The market fell 300 pips in just a few hours. The smell of panic was in the air!
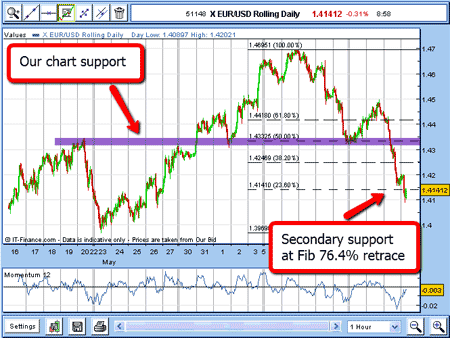
So here is the situation as ofThursday morning (June 16):

(Click on chart for a larger version)
On the hourly chart, I have drawn the Fibonacci retracement levels from the recent 23 May low to the 7 June high the latest big wave.
I have drawn the 1.4430 chart support level with a purple bar. And guess what? It lies right on the Fibonacci 50% retrace of the last wave. What a nice synchronicity and one that is common in the large markets, such as the EUR/USD.
Where can we find the next level of support?
So now that support isgone, where is the next support?
It is likely to be at or near the next Fibonacci level, which is the 76.4% level at the 1.4140 area.
Already the market has overshot that level to the downside, and as I write,is currently trying to rally up to correct the very oversold momentum reading (notice the huge spike down toWednesday night's low).
This would be a great secondary point for short-term traders to take profits from the shorts established in the 1.4650 area (see previous emails), for a tidy 500+ pip profit in just a few days.
This example is just one way we can use support and resistance levels, which are gleaned from a second's glance at a price chart, to determine entry and exit points.
Of course, we can use these ideas in all time frames. One very current long-term one is the USD/JY, which is currently toying with the 80 area and this is a 20-year support level!
I will write about this market in a forthcoming email.
NB: Don't miss my next trading insight. To receive all my spread betting blog posts by email, as soon as I've written them, just sign up here .
Get the latest financial news, insights and expert analysis from our award-winning MoneyWeek team, to help you understand what really matters when it comes to your finances.
John is is a British-born lapsed PhD physicist, who previously worked for Nasa on the Mars exploration team. He is a former commodity trading advisor with the US Commodities Futures Trading Commission, and worked in a boutique futures house in California in the 1980s.
He was a partner in one of the first futures newsletter advisory services, based in Washington DC, specialising in pork bellies and currencies. John is primarily a chart-reading trader, having cut his trading teeth in the days before PCs.
As well as his work in the financial world, he has launched, run and sold several 'real' businesses producing 'real' products.
-
 Average UK house price reaches £300,000 for first time, Halifax says
While the average house price has topped £300k, regional disparities still remain, Halifax finds.
-
 Barings Emerging Europe trust bounces back from Russia woes
Barings Emerging Europe trust has added the Middle East and Africa to its mandate, delivering a strong recovery, says Max King