A poor forecast can still turn out well
In spite of your best analysis, markets can still throw up surprises. John C Burford explains why that needn't be a disaster.
Get the latest financial news, insights and expert analysis from our award-winning MoneyWeek team, to help you understand what really matters when it comes to your finances.
You are now subscribed
Your newsletter sign-up was successful
Want to add more newsletters?

Twice daily
MoneyWeek
Get the latest financial news, insights and expert analysis from our award-winning MoneyWeek team, to help you understand what really matters when it comes to your finances.

Four times a week
Look After My Bills
Sign up to our free money-saving newsletter, filled with the latest news and expert advice to help you find the best tips and deals for managing your bills. Start saving today!
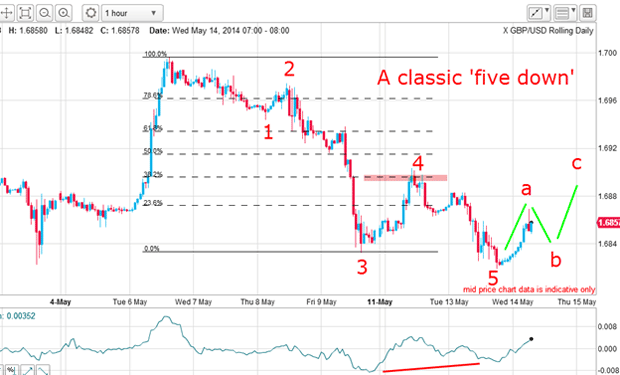
Today, I'm going to continue with the theme of Elliott wave theory and how it provides you with a roadmap which the market is likely to follow.
Of course forecasting, even with this method, still remains an uncertain art/science. Markets can always throw up surprises, sometimes after very careful analysis that later proves inaccurate.
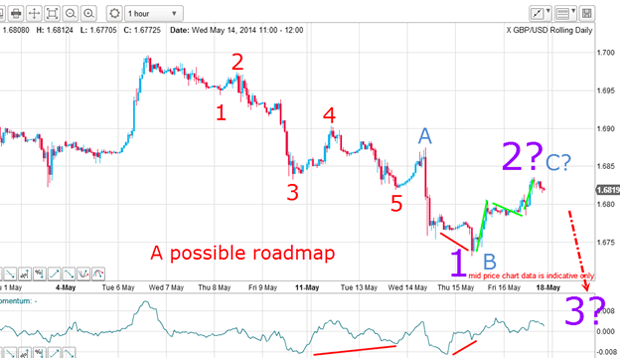
One such example is the Elliott wave pattern I proposed for the GBP/USD following the big swoon off the 1.70 top in my 14 May post. This was my suggested Elliott wave roadmap:
MoneyWeek
Subscribe to MoneyWeek today and get your first six magazine issues absolutely FREE

Sign up to Money Morning
Don't miss the latest investment and personal finances news, market analysis, plus money-saving tips with our free twice-daily newsletter
Don't miss the latest investment and personal finances news, market analysis, plus money-saving tips with our free twice-daily newsletter

I was looking for a rally in an A-B-C off my five-wave impulse pattern. That is the most common path for the market to travel.
And that is the problem. Sometimes in a very weak market, there isn't time for a proper A-B-C relief rally to form, and the market heads down relentlessly. And that is exactly what happened last week. But it was an unexpected move that I could live with!
Drawing a new roadmap

There was only a weak A wave rally off my wave 5 low and then a complete collapse below my wave 5 low, followed by a relief rally in an A-B-C form (green lines).
If I have the five waves down correctly labelled, the up-down-up off the B wave low is an A-B-C. I can then pencil in the wave labels of the one larger pattern. The low is wave 1 and the rally is wave 2. If this is correct, then we should expect wave 3 down to start very soon.
How will I know if wave 3 has started? Because third waves are long and strong, and swift declines would give the game away.
Now I have a new roadmap. If the market starts to decline hard, then I have my labels correctly placed. But if the rally extends, wave 2 (purple) could lie higher up and still obey the labels. In any event, the market is heading down and aiding my short positions.
How to forecast likely targets

It is always a good idea to keep in mind the bigger picture when focusing on the near-term action. In particular, zoom the screen back in time and see where the previous support and resistance zones are located. This will give you clues as to the likely target areas for the new trend.
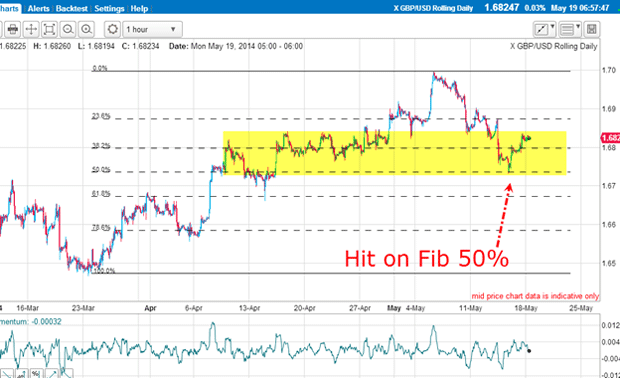
Here is the hourly chart covering the rally off the major low made on 23 March. I have highlighted the wide congestion zone made on the way up. The upper limit was the area that contained minor rallies and was likely to be support on the way down.
Following the 1.70 top, this congestion zone was likely to provide support on the way down. That is a common feature of markets. And when the market made a precise hit on the Fibonacci 50% retracement of the entire rally, that was all the excuse needed for the market to make a bounce off the deeply oversold momentum readings.
In addition, there was a large positive-momentum divergence at the low on the hourly chart, thus providing solid evidence for an expected bounce.
That was an ideal place to exit at least some short-term short positions.
Where will this market go?

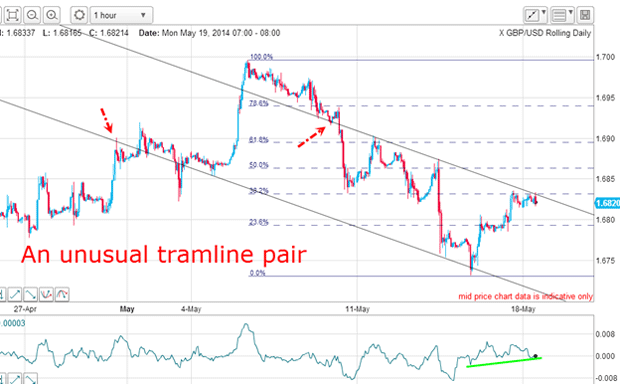
Here is an unusual tramline pair but they both have good PPPs (prior pivot points), which you can see where the red arrows are on the chart. And the lower tramline sports an overshoot at the low, which is usually a precursor to a good bounce. That was another clue to expect a rally.
Now the market has rallied to the upper tramline this morning in an A-B-C pattern. In addition, it has carried to the Fibonacci 38% retrace of the move off the 1.70 high a possible turning point.
Note the green line I have drawn across the lows on the momentum chart. If this resistance holds here at the tramline, the move back down will cause the momentum to break the green support line. This is potentially bearish.
But a move up through the Fibonacci 38% level would mean that the rally had not run out of steam just yet. That would imply a break of my upper tramline, of course. Also, the move down could be construed as an A-B-C corrective pattern. I would not dismiss this interpretation at all.
The market remains vulnerable
| (Contracts of GBP 62,500) | Row 0 - Cell 1 | Row 0 - Cell 2 | Row 0 - Cell 3 | Open interest: 230,333 | ||||
| Commitments | ||||||||
| 71,168 | 39,413 | 3,098 | 114,382 | 168,710 | 188,648 | 211,221 | 41,685 | 19,112 |
| Changes from 05/06/14 (Change in open interest: -10,931) | ||||||||
| -12,626 | -3,735 | 120 | 6,207 | -3,760 | -6,299 | -7,375 | -4,632 | -3,556 |
| Percent of open in terest for each category of traders | ||||||||
| 30.9 | 17.1 | 1.3 | 49.7 | 73.2 | 81.9 | 91.7 | 18.1 | 8.3 |
| Number of traders in each category (Total traders: 119) | ||||||||
| 40 | 29 | 14 | 31 | 34 | 76 | 72 | Row 8 - Cell 7 | Row 8 - Cell 8 |
Speculators remain about two-to-one bullish, but note the changes during the week. The decline caused both hedge funds and small speculators to reduce their long positions, as is normal during a sharp decline. But at the same time, they did not increase their short positions in fact, they dumped shorts as well.
This action tells me that the market remains vulnerable to further downside. That's because the reduced short position means there are fewer shorts to be squeezed to power up a big rally.
Get the latest financial news, insights and expert analysis from our award-winning MoneyWeek team, to help you understand what really matters when it comes to your finances.
John is is a British-born lapsed PhD physicist, who previously worked for Nasa on the Mars exploration team. He is a former commodity trading advisor with the US Commodities Futures Trading Commission, and worked in a boutique futures house in California in the 1980s.
He was a partner in one of the first futures newsletter advisory services, based in Washington DC, specialising in pork bellies and currencies. John is primarily a chart-reading trader, having cut his trading teeth in the days before PCs.
As well as his work in the financial world, he has launched, run and sold several 'real' businesses producing 'real' products.
-
 ISA fund and trust picks for every type of investor – which could work for you?
Whether you’re an ISA investor seeking reliable returns, looking to add a bit more risk to your portfolio or are new to investing, MoneyWeek asked the experts for funds and investment trusts you could consider in 2026
-
 The most popular fund sectors of 2025 as investor outflows continue
It was another difficult year for fund inflows but there are signs that investors are returning to the financial markets