You are now subscribed
Your newsletter sign-up was successful
Want to add more newsletters?

Twice daily
MoneyWeek
Get the latest financial news, insights and expert analysis from our award-winning MoneyWeek team, to help you understand what really matters when it comes to your finances.

Four times a week
Look After My Bills
Sign up to our free money-saving newsletter, filled with the latest news and expert advice to help you find the best tips and deals for managing your bills. Start saving today!
As you know, I have been bearish on gold for some time. I had felt so alone in believing that trading from the short side offered greater profit opportunities. Until the big second top at $1,920 an ounce was made in early September, that is.
The big decline off this top has drawn more traders to my view, and I now have some company.
MoneyWeek
Subscribe to MoneyWeek today and get your first six magazine issues absolutely FREE

Sign up to Money Morning
Don't miss the latest investment and personal finances news, market analysis, plus money-saving tips with our free twice-daily newsletter
Don't miss the latest investment and personal finances news, market analysis, plus money-saving tips with our free twice-daily newsletter
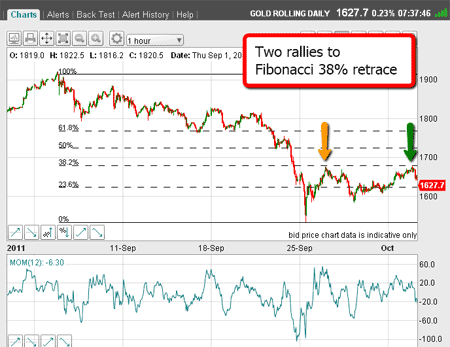
I had pencilled in an A-B-C labelling, where wave C had hit the Fibonacci 38% retrace. We know from Elliott wave theory that A-B-C waves are corrective to the main trend, which is down.
In fact, if you can spot a clear A-B-C pattern on a chart, that is confirmation you have identified the correct trend direction. It is one of the giveaways I use constantly.
For more details on how to use Elliott wave theory, see my video tutorial: An introduction to Elliott wave theory.
Would gold's rally hold?
Since then, the market did stage a further rally back to the same Fibonacci 38% level. This was going to be a critical point would that level hold or not?
Here is the chart showing the two touch points to the Fibonacci 38% level marked by the yellow and green arrows:
(Click on the chart for a larger version)
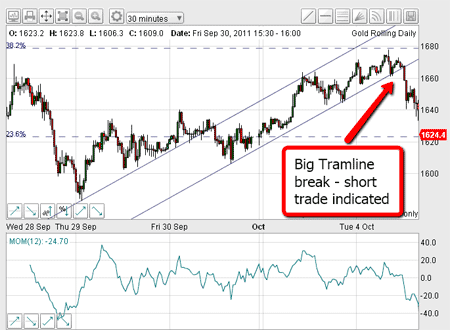
At the green arrow, I needed to become ultra-alert to developments. For guidance, I needed to search for short-term tramlines.
And I found a beautiful pair on this 30-minute chart:
(Click on the chart for a larger version)
Using the low of 29 September as one anchor point, I was able to draw a tramline clean across the lows of Friday and the important high on Monday.
My parallel line was easy to draw right across the lows from late Friday.
It was looking good yesterday for a possible reversal, especially now that a potential negative momentum divergencewas forming.
On the far right of the chart, we see the rally to the $1,680 Fibonacci 38% level. That was a key level. If my lower tramline held, we should have seen a move above the $1,680 level.
Instead, we got a sharp break of my lower tramline where I was waiting with sell orders!
That was confirmation that the second rally high to the Fibonacci 38% level had held.
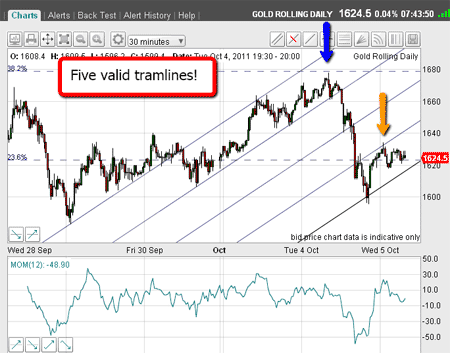
Now the lower tramline had broken, I immediately put in another third tramline underneath to give me a target.
(Click on the chart for a larger version)
Multiple tramlines are crossed
The market bounced off this third tramline, then plunged below in cascades of selling.
With that break, I drew in my fourth tramline equidistant from the third one. And that one also was penetrated in short order, so I had to draw in a fifth tramline.
That one, too was penetrated with a slight overshoot.
But of course, no market drops forever and momentum was getting washed out, and so this was the area where the market could stage a relief rally.
That was some selling as stop-loss orders were hit on the cascade down.
But note the relief rally has carried to the underside of my fourth tramline so far.
A short-term trader would have shorted at the $1,660 area and covered at the $1,610 area for a superb gain of $50+, or a profit of £500+ per £1 spread bet.
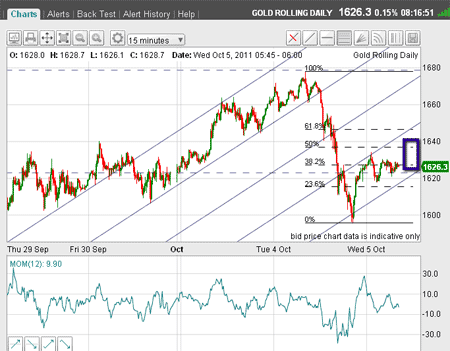
OK, what now? Here is the latest chart as of this morning:
(Click on the chart for a larger version)
I have drawn in the Fibonacci levels from yesterday's high and low. The relief rally should stop at one of these levels, or close to it.
Already, the 38% level has been reached, and there is a real possibility that the 50% level at the $1,635 area can be attained. That would be a great place to offer some short trades, especially if a negative momentum divergence can be seen.
But longer-term traders will be happy to sit on their short trades made in the $1,660 area. They will be looking for the market to challenge the $1,532 low and move below it.
Gold is proving to be a wonderful trading vehicle, along with the Dow and the euro and anyone using my methods on just these markets alone can take advantage.
If you're a new reader, or need a reminder about some of the methods I refer to in my trades, then do have a look at my introductory videos:
The essentials of tramline trading
An introduction to Elliott wave theory
Don't miss my next trading insight. To receive all my spread betting blog posts by email, as soon as I've written them, just sign up here .
-
 Average UK house price reaches £300,000 for first time, Halifax says
While the average house price has topped £300k, regional disparities still remain, Halifax finds.
-
 Barings Emerging Europe trust bounces back from Russia woes
Barings Emerging Europe trust has added the Middle East and Africa to its mandate, delivering a strong recovery, says Max King

