Where to now for gold?
As gold bounces back from its recent mini-slump, John C Burford scours the charts for some excellent short-term trades in gold's relief rally.
Get the latest financial news, insights and expert analysis from our award-winning MoneyWeek team, to help you understand what really matters when it comes to your finances.
You are now subscribed
Your newsletter sign-up was successful
Want to add more newsletters?

Twice daily
MoneyWeek
Get the latest financial news, insights and expert analysis from our award-winning MoneyWeek team, to help you understand what really matters when it comes to your finances.

Four times a week
Look After My Bills
Sign up to our free money-saving newsletter, filled with the latest news and expert advice to help you find the best tips and deals for managing your bills. Start saving today!
When I left gold on Monday, it had plunged to a low of around $1,530.
As I mentioned then, when the market was trading at around the $1,550 mark, I expected a strong relief rally. And that's what happened.
Let's take a look at the form of that rally.
MoneyWeek
Subscribe to MoneyWeek today and get your first six magazine issues absolutely FREE

Sign up to Money Morning
Don't miss the latest investment and personal finances news, market analysis, plus money-saving tips with our free twice-daily newsletter
Don't miss the latest investment and personal finances news, market analysis, plus money-saving tips with our free twice-daily newsletter
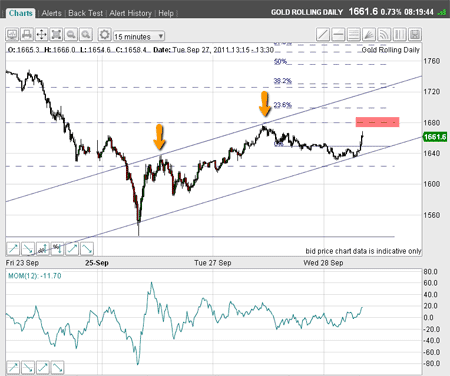
Below is the 15-minute chart from a little earlier today. The first wave of Monday's $1,530 low is a strong (high momentum) move up.
Then we had a pull-back as old longs who had not liquidated on the big down-move of last week were given a second chance to throw in the towel.

(Click on the chart for a larger version)
But, as I fully expected, the market made another rally, as old shorts, who had failed to take profits on the first wave down to $1,530, were presented with an opportunity to cover.
Now why did I expect this second rally wave? Simply because I reckoned the rapid massive $400 plunge off the $1,920 top had shaken the market to its core.
As I indicated on Monday, momentum readings were off the scale at the low. Markets must have time to recover from this trauma after all, they are extensions of us humans!
So, we have a possible A-B-C corrective pattern in place (the first yellow arrow marks A' and the second is C') complete with a negative momentum divergence at wave C. All the pieces are in place for a resumption of the decline towards my stated first target at sub-$1,500.
What are the tramlines saying?
On the chart above, I have drawn my upper tramline with the two highs as marked with yellow arrows.
The lower tramline is not very convincing there are no obvious touch points to make a solid tramline, so I am doing my best with this one. I expect it to fail at some stage!
Also on this chart, I have drawn in my Fibonacci retracements levels from the $1,920 high to Monday's $1,530 low.
I do expect the relief rally to peter out at or close to a Fibonacci level. And wave C came mighty close!
But now, the market is challenging this high (resistance is marked with the purple bar).
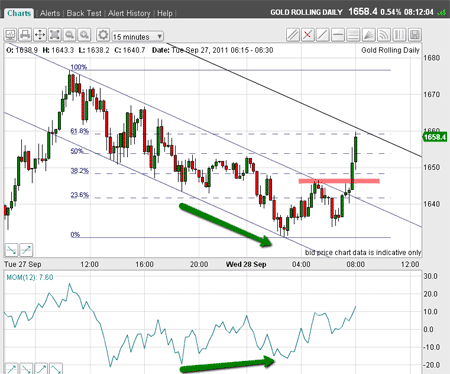
Why am I nervous about calling wave C the top? Here is an updated chart showing my tramlines drawn off the dip from the wave C high:

(Click on the chart for a larger version)
The dip from the wave C high shows a positive momentum divergence (the price hit a new low, but momentum didn't - marked by the green arrows). So this is taking the form of a classic corrective pattern to the up-move.
So now, I have a textbook long trade being presented!
If the positive momentum divergence is correctly telling me that the market is ready for a rally, I should place buy-stop orders in the region of the purple bar (because this is where the most recent minor high was hit).
If the rally ensues, where is my target?
Of course, at the third (upper) tramline, which I drew parallel and equidistant.
So this morning, I placed that trade at $1,645 and exited at the upper tramline target at $1,660 for a very quick $15 profit.
That was a pretty tramline trade, was it not?
Here is the chart as I write:

(Click on the chart for a larger version)
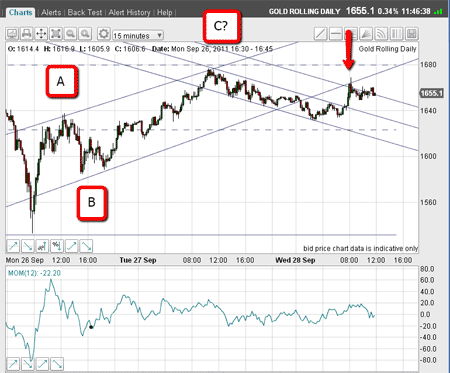
The market did rally above $1,660, but has not, as yet, exceeded the wave C high but it has hit the underside of my 'poor' up-sloping tramline (marked with red arrow)! So maybe this tramline is significant after all, and it was sheer luck I placed it there in the first place.
Still, I will take all the lucky trades going my way.
As I finish here, the market is drifting along my up-sloping tramline, so I will observe closely to see if my wave C does hold.
I know I have promised coverage of the Dow and euro, and I expect to give one of these some attention on Friday.
Also, if you're a new reader, or need a reminder about some of the methods I refer to in my trades, then do have a look at my introductory videos:
Tramlines: The essentials of tramline trading.
Elliott waves: An introduction to Elliott wave theory.
Fibonacci: Trading with Fibonacci levels.
Don't miss my next trading insight. To receive all my spread betting blog posts by email, as soon as I've written them, just sign up here .
Get the latest financial news, insights and expert analysis from our award-winning MoneyWeek team, to help you understand what really matters when it comes to your finances.
John is is a British-born lapsed PhD physicist, who previously worked for Nasa on the Mars exploration team. He is a former commodity trading advisor with the US Commodities Futures Trading Commission, and worked in a boutique futures house in California in the 1980s.
He was a partner in one of the first futures newsletter advisory services, based in Washington DC, specialising in pork bellies and currencies. John is primarily a chart-reading trader, having cut his trading teeth in the days before PCs.
As well as his work in the financial world, he has launched, run and sold several 'real' businesses producing 'real' products.
-
 ISA fund and trust picks for every type of investor – which could work for you?
Whether you’re an ISA investor seeking reliable returns, looking to add a bit more risk to your portfolio or are new to investing, MoneyWeek asked the experts for funds and investment trusts you could consider in 2026
-
 The most popular fund sectors of 2025 as investor outflows continue
It was another difficult year for fund inflows but there are signs that investors are returning to the financial markets