Where will gold's freefall end?
After topping out around $1,920 an ounce, the price of gold has gone in to freefall. But where will it end, and what does the gold market hold now? John C Burford examines the charts for clues.
Get the latest financial news, insights and expert analysis from our award-winning MoneyWeek team, to help you understand what really matters when it comes to your finances.
You are now subscribed
Your newsletter sign-up was successful
Want to add more newsletters?

Twice daily
MoneyWeek
Get the latest financial news, insights and expert analysis from our award-winning MoneyWeek team, to help you understand what really matters when it comes to your finances.

Four times a week
Look After My Bills
Sign up to our free money-saving newsletter, filled with the latest news and expert advice to help you find the best tips and deals for managing your bills. Start saving today!
With gold in total free-fall it fell another $100 over the weekend the short-term charts are proving pretty worthless in terms of tramline trading.
So we must go to the long-term charts.
But first, let me recap why I have been bearish on gold for some time and it was not easy being a bear while the market was zooming up. I had to bide my time.
MoneyWeek
Subscribe to MoneyWeek today and get your first six magazine issues absolutely FREE

Sign up to Money Morning
Don't miss the latest investment and personal finances news, market analysis, plus money-saving tips with our free twice-daily newsletter
Don't miss the latest investment and personal finances news, market analysis, plus money-saving tips with our free twice-daily newsletter
Bullish sentiment has been off the scale for some time, recording over 96% bulls at times. I have referred to the Commitments of Traders futures reports before, showing the lopsided positions of futures traders with small traders and hedge funds overwhelmingly long. This always gives me essential information about an impending top.
The herd had bought into the 'worthless fiat money' scenario in droves. I scoured the internet for stories that were not manically bullish gold, but came up empty-handed. That was a massive warning signal for me.
Price action since January has been exponential a classic sign of a bubble. But simply shorting because you have a feeling the market has 'gone too high' is suicidal the market just kept on climbing.
I needed a system to give me a handle on the best timing for a short entry at relatively low risk. That is where my tramline trading method came into its own.
So what is the daily chart telling me now?

(Click on the chart for a larger version)
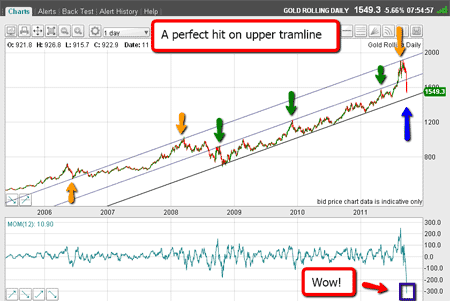
The chart goes back six years, and I am able to draw an excellent central tramline with great touch-points marked by green arrows.
Then my upper tramline draws itself!
I have three great touch-points marked by yellow arrows - and you can see that it passes right through the double top at $1,920.
Isn't that pretty? That was an area ripe for hunting for a major top, of course.
Right after the second top was put in on 6 September, I could draw this upper tramline with confidence.
If you haven't seen my new video tutorial on tramline trading, watch it here: The essentials of tramline trading.
Beware: we are in unchartered waters
So, I have found the top, the question now is: where will this freefall end?
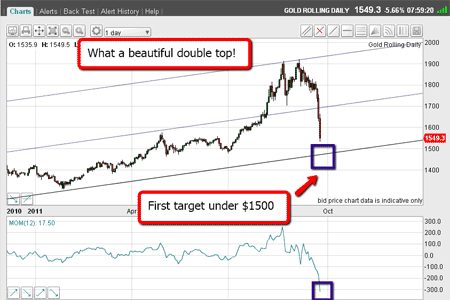
Here is a close-up of the recent precipitous action:

(Click on the chart for a larger version)
The market came down off the peaks and sliced right through my central tramline.
I was expecting at least some kind of bounce there, but the market was in total liquidation mode, and wasn't stopping for anything.
It is now gunning for my lower tramline at sub-$1,500.
But just look at the massively oversold momentum readings (marked by purple box). It has been a very long time since I have seen such readings on the daily charts.
In more than one sense, we are in uncharted waters.
But, of course, we shall see a massive bounce at some stage earlier, rather than later, I expect.
That's when the volatility will zoom up.
I shall be taking profits on most of my positions and may even look at a long trade, but will not hang around for long, as picking pennies in front of a moving steamroller is a hazardous occupation.
Hopefully, I will be able to cover the Dow and the euro this week if the gold market will allow me!
These are incredibly exciting times in the markets, and I hope you are finding my ideas useful in your own trading.
If you're a new reader, or need a reminder about some of the methods I refer to in my trades, then do have a look at my introductory videos:
Tramlines: An introduction to tramline trading.
Elliott waves: An introduction to Elliott wave theory.
Fibonacci: Trading with Fibonacci levels.
Don't miss my next trading insight. To receive all my spread betting blog posts by email, as soon as I've written them, just sign up here .
Get the latest financial news, insights and expert analysis from our award-winning MoneyWeek team, to help you understand what really matters when it comes to your finances.
John is is a British-born lapsed PhD physicist, who previously worked for Nasa on the Mars exploration team. He is a former commodity trading advisor with the US Commodities Futures Trading Commission, and worked in a boutique futures house in California in the 1980s.
He was a partner in one of the first futures newsletter advisory services, based in Washington DC, specialising in pork bellies and currencies. John is primarily a chart-reading trader, having cut his trading teeth in the days before PCs.
As well as his work in the financial world, he has launched, run and sold several 'real' businesses producing 'real' products.
-
 Average UK house price reaches £300,000 for first time, Halifax says
While the average house price has topped £300k, regional disparities still remain, Halifax finds.
-
 Barings Emerging Europe trust bounces back from Russia woes
Barings Emerging Europe trust has added the Middle East and Africa to its mandate, delivering a strong recovery, says Max King