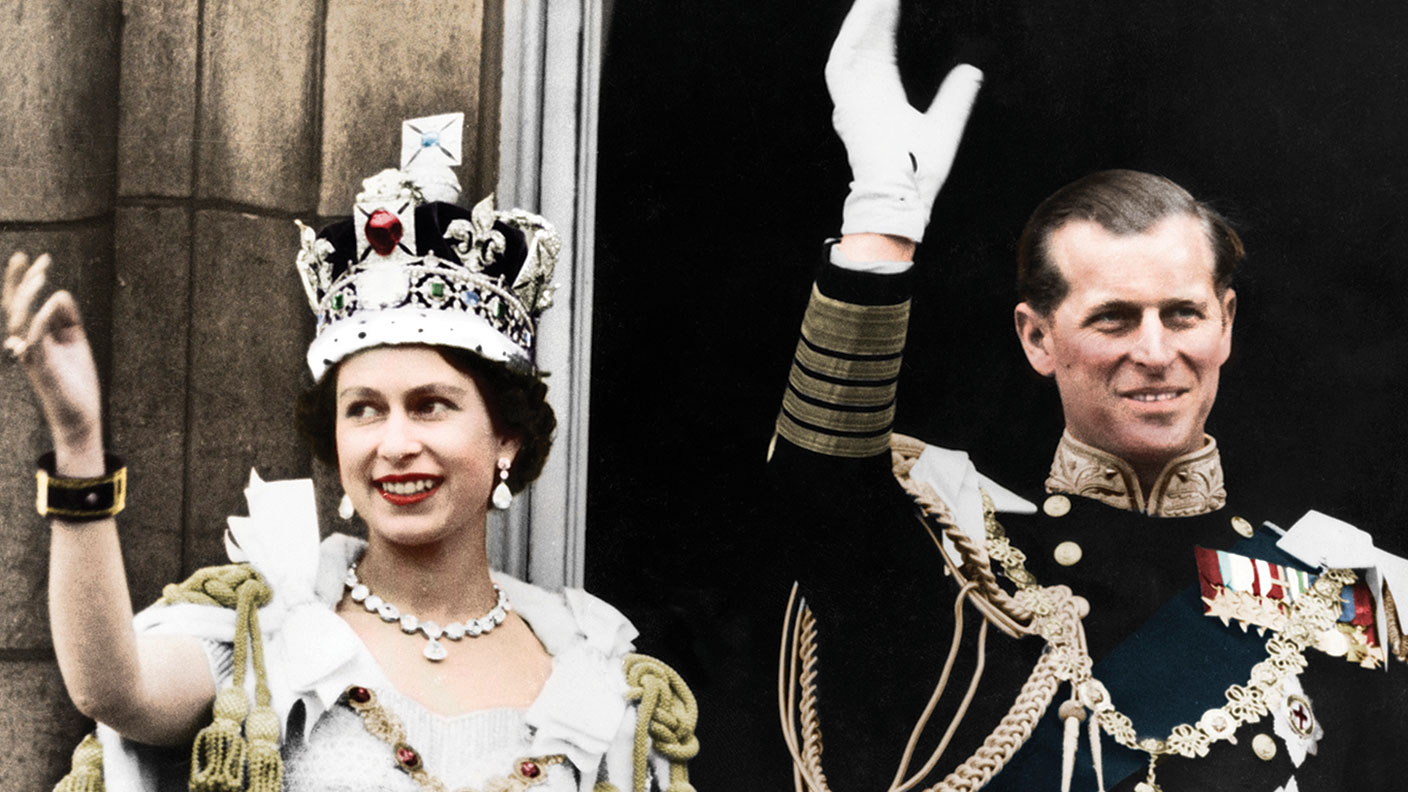
How the UK has changed in the last 70 years since the Queen took the throne
The last 70 years have been eventful and often difficult, but the UK is far wealthier than it was when the Queen took the throne in 1952. Simon Wilson reports.
Get the latest financial news, insights and expert analysis from our award-winning MoneyWeek team, to help you understand what really matters when it comes to your finances.
You are now subscribed
Your newsletter sign-up was successful
Want to add more newsletters?

Twice daily
MoneyWeek
Get the latest financial news, insights and expert analysis from our award-winning MoneyWeek team, to help you understand what really matters when it comes to your finances.

Four times a week
Look After My Bills
Sign up to our free money-saving newsletter, filled with the latest news and expert advice to help you find the best tips and deals for managing your bills. Start saving today!
What was life like in 1952?
The year of the Queen’s accession was the year that post-war tea rationing ended and Britain saw its first TV detector van. Few people could afford televisions, though, because they cost around £1,800 in today’s money – nor fridges, at around £1,000. It was the year the first music singles chart was published, the Flower Pot Men began broadcasting, and Agatha Christie’s new thriller The Mousetrap opened in the West End. Toxic smog killed 4,000 Londoners, while across the country tramways were being ripped up to make urban centres more accessible for motorcars. On average, Britons spent around 30% of their income on food, compared with 10% today.
How was the economy doing?
MoneyWeek
Subscribe to MoneyWeek today and get your first six magazine issues absolutely FREE

Sign up to Money Morning
Don't miss the latest investment and personal finances news, market analysis, plus money-saving tips with our free twice-daily newsletter
Don't miss the latest investment and personal finances news, market analysis, plus money-saving tips with our free twice-daily newsletter
The UK was emerging from post-war austerity as the world’s third biggest economy, behind the United States and the Soviet Union. Half the world’s trade was conducted in sterling, and the government had the benefit of gold reserves from 84 Commonwealth members. National debt was high, but falling from a post-war peak of 250% of GDP as growth helped stabilise the public finances. Interest rates and unemployment were low (though only 35% of women were in paid employment, compared with 72% now). However, much like today, Britons were feeling a cost of living squeeze, with inflation leaping from under 2% to more than 10%, in part fuelled by the Korean war and a resulting commodities price spike.
What about investment?
In 1952 it was difficult and expensive for most people to buy stocks, and there were few funds, says Luke Hickmore of abdrn in Investment Week. It is hard to be precise given gaps in data from the 1950s and 1960s, but assuming an average annual return of 2.4% after inflation, £100 invested in equities in 1952 could be worth £536 today (in real terms). Of 1952’s top-30 firms, only four still exist: British American Tobacco, Imperial Brands, Tate & Lyle and Rolls-Royce.
How much did people earn in 1952?
A good estimate is that average weekly earnings were £6.04 in 1952, compared with £605 in the second quarter of this year, says David Smith in The Sunday Times. So earnings have increased about a hundredfold over the course of the Queen’s reign. Prices have increased too – but nowhere near as fast. Inflation averaged a hefty 6.4% between 1952 and 1988, but only 2.5% from 1989 until now. That means that prices have risen by a factor of 20 (on Bank of England figures) – far less than wages.
Meaning that we are all far richer?
The main economic feature of the past 70 years has been deindustrialisation and the widening disparities – between and within regions – that have accompanied the shift towards a services economy. On average, though, we are definitely much better off. The UK economy is more than five times bigger (in real terms) now than in 1952. Factor in a population increase of about a third and that means average incomes are about four times bigger, according to PwC. In today’s money, GDP has risen from around £8,500 per person in 1952 to £32,600 now. However, the amount of our money spent by the government has barely changed. The state accounted for 41% of GDP in 1952, compared with 43% this year. What that’s spent on has changed, though. Defence spending has dropped from 23% to 5%, while health has jumped from 7% to 20%.
Is that due to an ageing population?
Increases in longevity are a “triumph” of the past 70 years, said Jonathan Cribb and David Sturrock in an IFS paper (“The Platinum Jubilee generation: how are they doing?”). Of the people born in 1952, 76% of men and 84% of women have made it to age 70. Compare that with those born 70 years earlier in 1882: only 34% of men and 45% of women are estimated to have survived to 1952. Those turning 70 this year can expected to live to 86 for men and 88 for women – an extra six years of life compared with their 1952 equivalents. Moreover, this “Platinum Jubilee generation” is also “the richest in history so far”. Expressed in today’s prices, this generation’s incomes peaked in 2005 (when they were aged 53) at £27,800, a full £5,700 higher than the UK average. But even now, in retirement, they have incomes of £26,400 per year on average. That’s 6% (£1,500) more than the population. Much of that is to do with house prices. Some 85% of those born in 1952 are homeowners and 14%, or one-in-seven, own a second home.
What’s happened to house prices?
Elizabeth’s reign kicked off with a housebuilding bonanza. Between 1952 and 1958 some 2.15 million homes were built, 1.4 million by local authorities, according to research by estate agency Savills. Yet in the long run houses have been a glaring exception to the rule that pay has kept up with – and beaten – price increases. In 1952, the average house price was £1,891, according to the Nationwide Building Society’s house-price index. That’s equivalent to £39,065 (using the Bank of England’s calculator for 2021). The latest average for the Nationwide index is £260,771 – meaning that house prices have vastly exceeded both general inflation and average earnings. Broadly, houses cost about four times the average (male) earnings then, compared with eight times now.
What does this imply?
It implies a huge strain on the economy, government finances and social solidarity in the coming decades, as the anger of younger generations over housing inequalities crashes into unfavourable demography. In 1952 there were 5.5. people of working age for each person aged 65 and over, says Les Mayhew of the International Longevity Centre. Longer life expectancy and falling birth rates mean this ratio is now just 3.3. Projections suggest that it could fall to 2.3 by 2040 – around the time we might expect, barring a republican revolution, the accession of King William V
Get the latest financial news, insights and expert analysis from our award-winning MoneyWeek team, to help you understand what really matters when it comes to your finances.
-
 Average income tax by area: The parts of the UK paying the most tax mapped
The UK’s total income tax bill was £240.7 billion 2022/23, but the tax burden is not spread equally around the country. We look at the towns and boroughs that have the highest average income tax bill.
-
 BBC TV licence fee hike confirmed: can you reduce how much you pay?
The cost of a TV licence fee is set to rise by over 3%, but there are ways to reduce the bill.
-
 "Botched" Brexit: should Britain rejoin the EU?
Brexit did not go perfectly nor disastrously. It’s not worth continuing the fight over the issue, says Julian Jessop
-
 'AI is the real deal – it will change our world in more ways than we can imagine'
Interview Rob Arnott of Research Affiliates talks to Andrew Van Sickle about the AI bubble, the impact of tariffs on inflation and the outlook for gold and China
-
 Tony Blair's terrible legacy sees Britain still suffering
Opinion Max King highlights ten ways in which Tony Blair's government sowed the seeds of Britain’s subsequent poor performance and many of its current problems
-
 How a dovish Federal Reserve could affect you
Trump’s pick for the US Federal Reserve is not so much of a yes-man as his rival, but interest rates will still come down quickly, says Cris Sholto Heaton
-
 New Federal Reserve chair Kevin Warsh has his work cut out
Opinion Kevin Warsh must make it clear that he, not Trump, is in charge at the Fed. If he doesn't, the US dollar and Treasury bills sell-off will start all over again
-
 How Canada's Mark Carney is taking on Donald Trump
Canada has been in Donald Trump’s crosshairs ever since he took power and, under PM Mark Carney, is seeking strategies to cope and thrive. How’s he doing?
-
 Rachel Reeves is rediscovering the Laffer curve
Opinion If you keep raising taxes, at some point, you start to bring in less revenue. Rachel Reeves has shown the way, says Matthew Lynn
-
 The enshittification of the internet and what it means for us
Why do transformative digital technologies start out as useful tools but then gradually get worse and worse? There is a reason for it – but is there a way out?