Where next for stocks?
Despite the rash of investor optimism and the healthy-looking uptick in markets, there is plenty of evidence to suggest that we're still mired in a primary bear market. So should you be buying shares now?
Two weeks ago we explained that FTSE's price action had created a range between the levels of 4150 and 3850, we said that a break above 4150 would suggest a return to strength or, on weakness below 3850, confirmation of a short-term top of considerable importance. The break was to the upside, following which there has been further strength. We must now try to work out what is likely to happen next, what action we should take and very specifically, do we believe that the economies of the developed world are set to recover and the bear market is over. Are we now at the beginning of a new equity bull market?
The first point of reference is to look at historic examples; in particular, the American stock market post 1929 and the Japanese stock market post 1990.
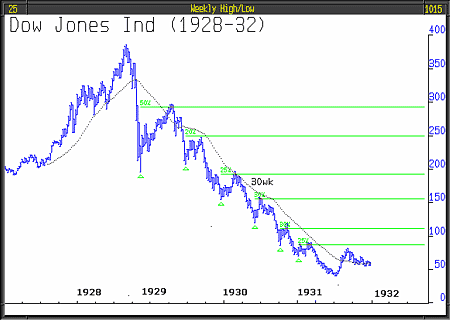
Dow Jones Industrial Average (192832)
This bear market that commenced in October 1929, was very orderly in its behaviour. Except for the first rally of 50%, the 30-week moving average remained above the price at all times. The rallies, after the first, were from 20% to as much as 30%.
Try 6 free issues of MoneyWeek today
Get unparalleled financial insight, analysis and expert opinion you can profit from.

Sign up to Money Morning
Don't miss the latest investment and personal finances news, market analysis, plus money-saving tips with our free twice-daily newsletter
Don't miss the latest investment and personal finances news, market analysis, plus money-saving tips with our free twice-daily newsletter
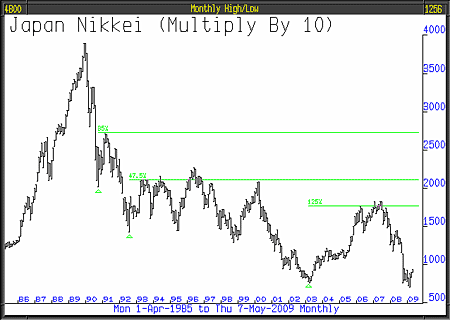
Japan Nikkei Dow
Probably the most pernicious primary bear market ever. Here the rallies have varied from 35% to 125%. The post 1990 Japanese bear market and the economic conditions that caused it are, in many ways, similar to those today.

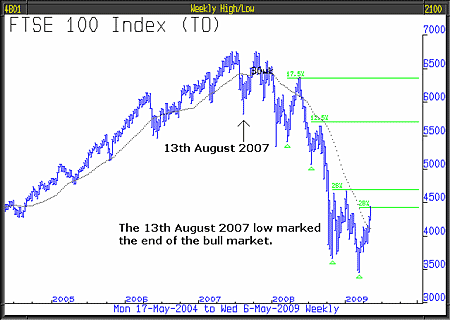
The five-year weekly chart for the FTSE shows both bull and bear market action. We would first draw your attention to the left hand side of the chart, the bull phase, during which FTSE, although predominantly supported by the 30-week moving average, did regularly puncture that indicator, but in each case the decline did not fall below the preceding low that is, until 13th August 2007. The end of the bull market was defined by the coincidence of two technical actions - the violation of the 30-week moving average and, on 13th August 2007, the price falling below the previous low. After that, following a last short rally which failed to exceed the previous high, the action was all to the downside.
FTSE's recent rally, of 28%, followed one in October 2008 of 27% and two others of 12.5% and 17.5%. Although this latest move has taken the price through the 30-week moving average, that also occurred at the end of the first rally and repeatedly during the preceding bull market. Until the level of 4690 is exceeded, in our opinion, the primary bear market still lives.
So what to make of this - Our first observation is that this rally, even if we are in the early stages of a new bull market, is very overbought. From about here, we would expect either a total capitulation and the return to bear market conditions, or a significant pull-back. So in the short term we propose to wait and watch. Once a pull-back is underway, it should be at least 50% of the previous move up, it will give us the opportunity to reconsider and if need be, take action to change. Much then will depend on our fundamental analysis, the recent data and the trigger that initially caused the return to weakness.
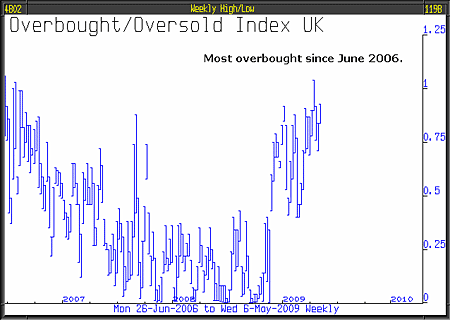
The technical position is straightforward, a legitimate primary bear market is still in place and the rally is extremely extended. One way or another, over the next week or two, it should be plain sailing to move the portfolio in one direction or another.
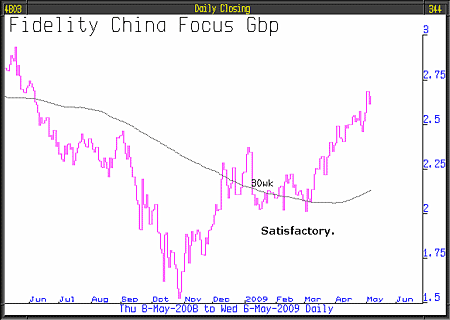
Over the recent period, the portfolio has benefited from investments held in the Chinese stock market. We are contemplating an expansion of our emerging market exposure depending upon continued strength. The perfect outcome, which we believe to be quite possible, is that the emerging markets continue to head north whilst the developed world markets head south.
This bear market has been characterised by relentless deception; for example, in March, Ken Lewis, Chairman of Bank of America, said emphatically that BofA needed no more capital it is now reported that $34 billion is required. Citicorp said to investors, "Our regulatory capital base is strong" it is now reported that they need another $50 billion. Unfortunately, the announcement concerning the stress test results is to be made late Thursday evening, too late for this letter.
These two misleading statements and many more besides, have been part of the scene since before the bear market started.
So from where can we gain an insight into the truth? One answer is to search out the people who do know and see what they are doing with their own money. Probably the most enlightening news this last two weeks was to learn that senior officers of US corporations, in April sold stock to the value of $353 million, 8.3 times the stock they bought, which was only $42.5 million - the least amount purchased by such insiders since June 1992. If you take the view that nobody ever sold a stock that they thought was going up - these guys know from the inside what's going on in their companies - they were selling into a bear market rally, not buying that is an invaluable insight!
Earlier this year sentiment was bleak and the survival of banks uncertain. Today, that uncertainty is believed to have lifted and simultaneously banks and others have delivered earnings that have pleasantly surprised. Citicorp announced profits in the first quarter this year of $1.6 billion. You might quite rightly ask 'how on earth did they do that?' the answer is by sleight of hand! Citi was able to take a once-only gain of $2.7 billion from marking to market the decline of its own debt otherwise they would have made a $1.1 billion loss. The value of Citi bonds had fallen because Citi was in such a dire state.
Extraordinarily, a greater decline would signify a greater Citi deterioration but would, at the same time, have generated a greater one-off profit. For such earnings to have been so well received, is extraordinary and a measure of the super vulnerability of the buoyant sentiment.
There is a whole plethora of less bad data and the news items at the front are the latest ones. Many are surveys; surveys tend to be coloured by the prevailing sentiment, so if in the short term the sentiment is euphoric, surveys will be better.
Lord Layard of the London School of Economics said "I have never felt so pessimistic. It is difficult to me that this recession is not going to be longer than others as well as deeper. We haven't seen half the problems in employment yet." And, Martin Wolf, in the Financial Times "They [central banks] are struggling with the deepest recession since the 1930s and a banking system on life support..."
This article was written by Full Circle Asset Management,as published in the threesixty Newsletter on 8 May 2009
