Asian stocks still offer long-term value
With stockmarkets up 90% in just seven months, some people may worry that Asian equities are in a bubble. But although Asia's not cheap any more, it's still not generally expensive, says Cris Sholto Heaton. Here, he explains where to find the continent's best value.

Get the latest financial news, insights and expert analysis from our award-winning MoneyWeek team, to help you understand what really matters when it comes to your finances.
You are now subscribed
Your newsletter sign-up was successful
Want to add more newsletters?

Twice daily
MoneyWeek
Get the latest financial news, insights and expert analysis from our award-winning MoneyWeek team, to help you understand what really matters when it comes to your finances.

Four times a week
Look After My Bills
Sign up to our free money-saving newsletter, filled with the latest news and expert advice to help you find the best tips and deals for managing your bills. Start saving today!
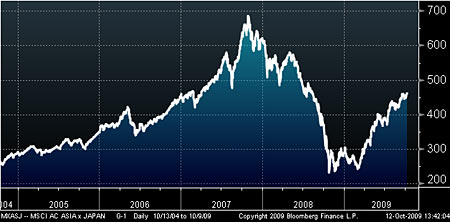
It's been a spectacular year - the MSCI Asia ex-Japan is up 90% since March. In the past, a recovery on that scale has normally taken two years or more; this time it's been just seven months.
Naturally many investors worry that this is too much too soon. They fear equities may be back into another bubble, inflated by easy money policies from central banks.
Some of those fears are overdone. Asian markets are generally not expensive. They're just not really cheap any more. But we should certainly expect some volatility over the next year, even though the long-term trend will be up...
MoneyWeek
Subscribe to MoneyWeek today and get your first six magazine issues absolutely FREE

Sign up to Money Morning
Don't miss the latest investment and personal finances news, market analysis, plus money-saving tips with our free twice-daily newsletter
Don't miss the latest investment and personal finances news, market analysis, plus money-saving tips with our free twice-daily newsletter
We're only back to pre-Lehman prices
First, let's look at the MSCI Asia ex-Japan in perspective. As you can see below, it's only just back up to the levels it was at before Lehman Brothers collapsed last September.
Figure 1. MSCI Asia ex Japan index

Given that most investors (including me) thought Asian markets were reasonably priced for decent long-term returns back then, it seems odd that we're now worrying that they're expensive. That's happening because many investors are anchoring on the size of the rebound rather than the broader picture.
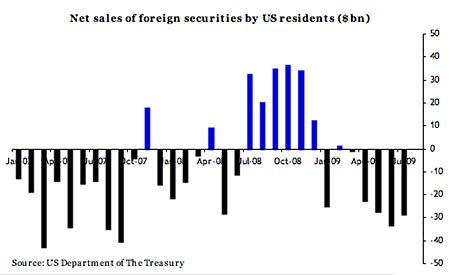
In any case, in the short term, sentiment is all-important. Investors' attitudes have turned positive thanks to a V-shaped recovery in the global economy and the flood of money back into risky assets. The chart below shows net sales of foreign securities by American investors; you can see how conditions have turned around from when they were repatriating their funds en masse at the peak of the crisis.
Figure 2. Net sales of foreign securities by US residents ($ bn)

And I think this rally can run for a while longer. There will be bad news, especially US unemployment, which is likely to remain stubbornly high. But there will also be enough that's good, or can be interpreted as good, to keep the bulls on top. In short, I would not want to bet against a global stock market as pumped up as this one.
However, at some point, it will become clear that Western economies are being propped up by unsustainable fiscal stimulus. The asset-price recovery is, after all, being driven to some extent by inventory rebuilding and short-term boosts; I still think it's likely to fade next year. Many firms - especially in the US - are also beating earnings forecasts by laying off staff to cut costs, a strategy that only works for a few quarters.
So at some point, we'll have a sell off. This is likely to be quite violent, but I think there's little prospect that we will get back down to the levels seen in March. Uber-bears seeking a sell off to rock-bottom valuations will be disappointed. And while both developed and emerging markets will sell off together in the short term, the long-run outlook is very different.
Asian decoupling isn't dead
Western markets reached peak valuations in 2000, when the S&P 500 traded on a cyclically-adjusted price/earnings ratio of around 45 times (the cyclically-adjusted p/e is the price/earnings ratio based on inflation-adjusted average earnings over the last ten years. As such, it attempts to smooth out the effect of the business cycle on earnings-to-value stocks on a long-term basis). They then entered a typical valuation bear market, in which stocks move from overvalued to undervalued over a long period of time.
This process is marked by sharp rallies and slumps over many years. Depending on the level of inflation, the nominal level of the index may not decline much over the whole period (the 1970s are a good example of this), but valuations decline significantly, to a point typically where the cyclically-adjusted p/e is in single digits. No market follows exactly the same pattern twice, but all the signs point to a final bottom that could easily be five years away.
However, Asia is very different. Stocks remain in a long-term bull market where sentiment will grow more positive as more people buy the Asian growth story over the next few years. The MSCI Asia ex-Japan peaked at three times book value in 2007; by the end of the long-term bull market, peak valuation is likely to be significantly higher (unfortunately, we don't have the long-term data to calculate cyclically-adjusted p/es for Asian markets, so we have to use simpler valuation techniques).
So over time, Asian markets will decouple from Western ones to some extent. This process can't happen overnight; Wall Street is still too important. And so in this cycle, Asia must sell off when Wall Street does. But as the Asia story takes hold, Wall Street's influence will diminish.
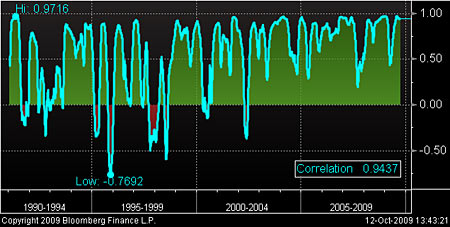
Indeed, this may already be happening. The chart below shows the correlation between the S&P500 and the MSCI Asia ex-Japan since 1990. As you can see, the markets are generally highly correlated in terms of direction, with an R-squared value of 0.94 (the maximum is one, implying perfect correlation). In short, when Wall Street rises, Asia rises; and when Wall Street falls, Asia falls.
Figure 3. Correlation between S&P500 and MSCI Asia ex-Japan

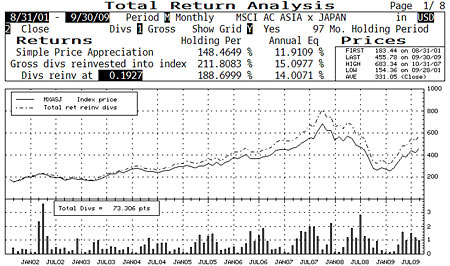
But what this doesn't tell us is that with each ebb and flow, Asia is gaining a little more and giving back less than the S&P. Indeed if we look at the returns, we can see that since 2000, the S&P500 has returned -0.9% per year in price terms and 1.1% per year in total return terms (with dividends reinvested). By comparison the MSCI Asia ex-Japan has returned 11.9% per year and 15.1% per year. In short, decoupling may already be underway.
Figure 4. S&P500, price return and total return
Figure 5. MSCI Asia ex-Japan, price return and total return

Where to find the best value
So that's the big picture. In terms of long-term strategy, I think trying to time the market precisely is probably a waste of effort. Except at times when the market is clearly grossly overvalued or undervalued, the strategy of gradually feeding your money into low-cost funds or individual stocks is the simplest way to go.
So which markets look to offer the best value at the moment? As the next table shows, the domestic Chinese and Indian markets, while not expensive, are among the most highly valued. I also think there's a real risk that the bubble that both experienced in 2007 will take longer to shakeout than many expect and that both are vulnerable to a big sell-off.
Figure 6. Asian markets, current valuations
table.ben-table table { border: 3px solid #2b1083;font: 0.928em/1.23em verdana, arial, sans-serif;}
th { background: #2b1083; padding: 10px 5px;color: white;font-weight: bold;text-align: center;border-left: 1px solid #a6a6c9;}th.first { padding: 5px 2px;text-align: left;}
tr {background: #fff;}
tr.alt {background: #f6f5f9; }
td { padding: 5px 2px;text-align: center;border-left: 1px solid #a6a6c9;color: #000;vertical-align: center;}td.alt { background-color: #f6f5f9; }td.bold { font-weight: bold; }td.first { text-align: left;}
| Australia (S&P/ASX200) | 97.82 | 17.17 | 2.03 |
| China (CSI300) | 33.63 | 22.08 | 3.25 |
| Homg Kong (Hang Seng) | 22.84 | 17.1 | 1.98 |
| India (Sensex) | 21.02 | 20.1 | 3.55 |
| Indonesia (JCI) | 32.62 | 15.68 | 2.7 |
| Japan (Topix) | negative | 38.28 | 1.11 |
| Malaysia (KLCI) | 23.62 | 17.1 | 2.15 |
| Philippines (PSEi) | 16.32 | 14.39 | 2.05 |
| Simgapore (STI) | 20.72 | 17.42 | 1.65 |
| South Korea (Kospi) | 35.95 | 14.18 | 1.29 |
| Taiwan(Taiex) | 120.17 | 25.14 | 2.15 |
| Thailand (SET) | 29.53 | 13.29 | 1.62 |
| Vietnam (VNIndex) | 22.95 | 17.62 | 2.87 |
So I'd rather be buying elsewhere. I think Indonesia's prospects are increasingly good, as I discuss here: Indonesia: one emerging market you can't afford to ignore. The two funds mentioned in that piece, the Van Eck Market Vectors Indonesia ETF (US:IDX) and the closed-end Indonesia Fund (US:IF) (now operated by Aberdeen Asset Management) remain the only two dedicated funds that I know of.
Vietnam is also promising. I wrote a short piece here for the MoneyWeek funds page: Enthusiasm for Vietnam is deserved, featuring two of the easiest ways to get access: The Deutsche Bank x-trackers FTSE Vietnam ETF (LN:XFVT) and the closed-end Vietnam Opportunity Fund (AIM:VOF).
For turnaround potential, I like Malaysia and Taiwan; both are economies that have stagnated a bit in recent years and fallen out of favour, but now look as if they could get back on track. This is a long topic; I'll write a more detailed piece on each with some investment ideas when I visit both in the next few weeks.
By contrast, I'm not keen on Thailand and South Korea, despite their apparent cheapness. Regular readers will be aware that I regard Thailand as a basket case due to its political problems (I wrote about this again recently on the newly-launched MoneyWeek blog: Thailand is cheap but it's not time to buy). I also have reservations about South Korea thanks to its shareholder unfriendly companies, relatively high debt levels in the economy and the ongoing problem of North Korea (not simply because of the present friction between the two, but also the enormous economic drag on the south that any eventual reunification will cause).
Two useful exchange traded funds
Lastly, many of you that were surveyed requested a reference guide to all the ETFs and investment trusts that are available for Asia. I'm putting together an ETF list at the moment and should be able to include it in a future email soon. Then I'll produce an overview of investment trusts and focus on some of my top picks. In the meantime, those of you looking for a good regional ETF may want to take a look at this piece I wrote for Index Universe: Asia Region ETFs. It's a bit more technical than MoneyWeek Asia and focuses on European-listed ETFs, but it's a good starting point if you want to understand the problem of picking ETFs in depth.
In a nutshell, I would suggest the DB x-trackers MSCI AC Asia Pacific ex-Japan (LN:XAXJ) for large caps and the iShares MSCI AC Far East ex Japan Small Cap (LN:ISFE) for a focus on smaller firms (but note that the second one doesn't have any exposure to India).
This article is from MoneyWeek Asia, a FREE weekly email of investment ideas and news every Monday from MoneyWeek magazine, covering the world's fastest-developing and most exciting region. Sign up to MoneyWeek Asia here
Get the latest financial news, insights and expert analysis from our award-winning MoneyWeek team, to help you understand what really matters when it comes to your finances.

Cris Sholt Heaton is the contributing editor for MoneyWeek.
He is an investment analyst and writer who has been contributing to MoneyWeek since 2006 and was managing editor of the magazine between 2016 and 2018. He is experienced in covering international investing, believing many investors still focus too much on their home markets and that it pays to take advantage of all the opportunities the world offers.
He often writes about Asian equities, international income and global asset allocation.
-
 Average UK house price reaches £300,000 for first time, Halifax says
While the average house price has topped £300k, regional disparities still remain, Halifax finds.
-
 Barings Emerging Europe trust bounces back from Russia woes
Barings Emerging Europe trust has added the Middle East and Africa to its mandate, delivering a strong recovery, says Max King