The charts that matter – a ray of hope in the US employment data
As US unemployment falls again, John Stepek looks at what it means for the markets and the global economy, plus a rundown of the rest of the charts that matter the most.

Get the latest financial news, insights and expert analysis from our award-winning MoneyWeek team, to help you understand what really matters when it comes to your finances.
You are now subscribed
Your newsletter sign-up was successful
Want to add more newsletters?

Twice daily
MoneyWeek
Get the latest financial news, insights and expert analysis from our award-winning MoneyWeek team, to help you understand what really matters when it comes to your finances.

Four times a week
Look After My Bills
Sign up to our free money-saving newsletter, filled with the latest news and expert advice to help you find the best tips and deals for managing your bills. Start saving today!
Welcome back. The MoneyWeek podcast is back Merryn interviews financial historian and bear market specialist Russell Napier, one of our favourite analysts. You shouldn't miss this one.
If you haven't yet bought my book on contrarian investing, The Sceptical Investor, hurry up and get your 25% discount when you pick up your copy here.
(If you have already read it, then please do leave a review on the Amazon page if you have the time from a selfish point of view, it helps with sales. And my ego.)
MoneyWeek
Subscribe to MoneyWeek today and get your first six magazine issues absolutely FREE

Sign up to Money Morning
Don't miss the latest investment and personal finances news, market analysis, plus money-saving tips with our free twice-daily newsletter
Don't miss the latest investment and personal finances news, market analysis, plus money-saving tips with our free twice-daily newsletter
And if you missed any of this week's Money Mornings, here's your chance to catch up.
Monday: A genuinely scary moment for markets
Tuesday: Are bond yields heading for new lows?
Wednesday: Corporate zombies are eating our brains
Thursday: Is it time to invest in Turkey?
Friday: House prices are sliding fast in London and it's spreading
And if you don't already subscribe to MoneyWeek, do it now you get your first six issues free when you sign up.
When we last talked, we were hovering on the edge of a recession signal, and this week it's more of the same. The yield curve (here's a reminder of what it is) did pull back from the brink a little this week. Although the ten-year US Treasury yield slid sharply, the two-year fell hard too, and so the gap between them opened a little.
The chart below shows the difference (the "spread") between what it costs the US government to borrow money over ten years and what it costs over two. Once this number turns negative, the yield curve has inverted which almost always signals a recession (although perhaps not for up to two years).
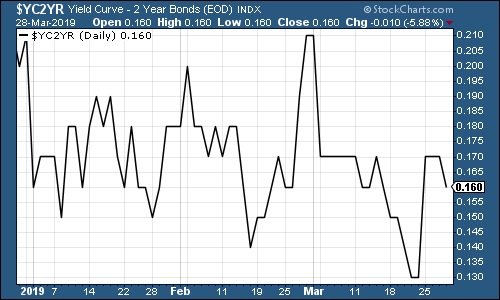
(The gap between the yield on the ten-year US Treasury and that on the two-year, going back three months)
Gold (measured in dollar terms) struggled this week as the US dollar powered ahead, helped by all of those investors piling into US Treasuries.
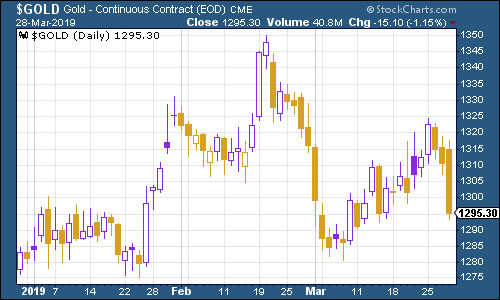
(Gold: three months)
The US dollar index a measure of the strength of the dollar against a basket of the currencies of its major trading partners put in a strong rebound, as noted above.
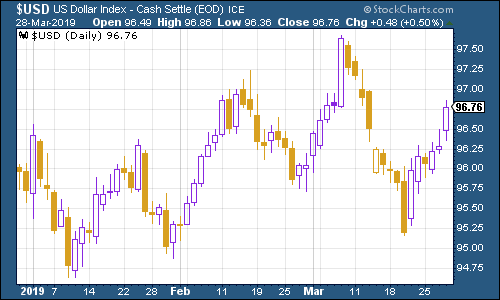
(DXY: three months)
Looking at ten-year yields on the world's major developed-market bonds the US slid sharply as the market continued to price in lower interest rates, and both the Japanese and German equivalents fell hard too. Japan is firmly back in negative territory and Germany has entered it. This week, I've lengthened the chart period so you can see what's going on over a longer timescale.
Global bond markets mostly bottomed out in July 2016, as the charts below all show. Will they revisit those levels? We've a way to go yet (apart from for Germany), but it's possible (although I'll admit it would surprise me).
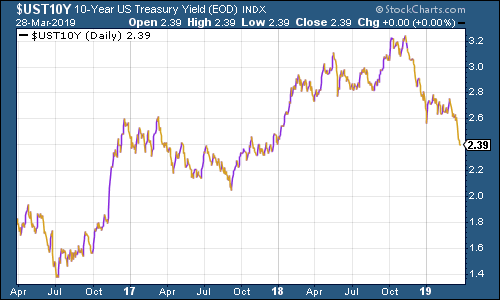
(Ten-year US Treasury yield: three years)
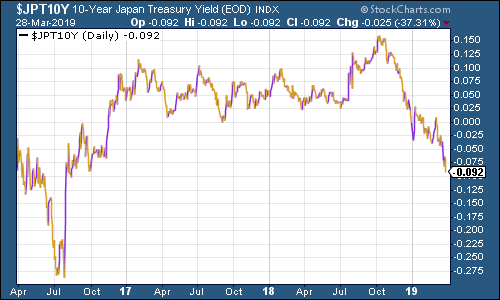
(Ten-year Japanese government bond yield: three years)
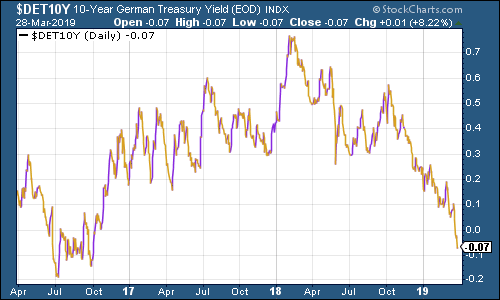
(Ten-year bund yield: three years)
Copper continued to trade sideways. If recession fears spread, and the dollar keeps rising, it's hard to see how copper hangs on.
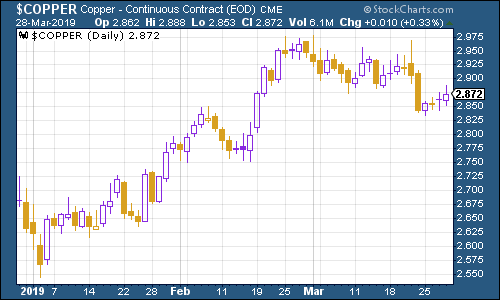
(Copper: three months)
The Aussie dollar our favourite indicator of the state of the Chinese economy fell back as the US dollar strengthened.
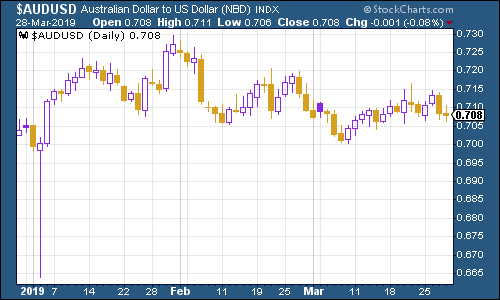
(Aussie dollar vs US dollar exchange rate: three months)
Cryptocurrency bitcoin is creeping back onto the radar of speculators, perking back up above the $4,000 mark.
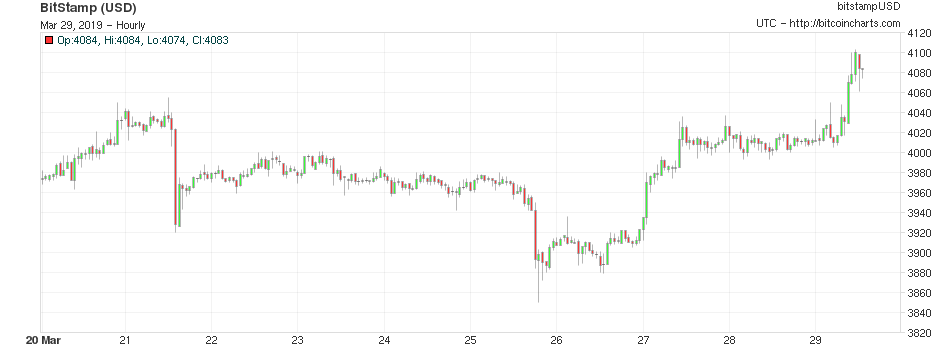
(Bitcoin: ten days)
Interesting move in the four-week moving average of weekly US jobless claims this week. It fell substantially to 217,250, while weekly claims fell by more than expected to 211,000.
There were also some revisions to past data. As a result, the previous trough (of 206,000, on 15 September 2018) has risen a little the marker to beat is now 210,500, which was set on 22 September).
Why does that matter? Well, in the past, David Rosenberg of Gluskin Sheff has noted that US stocks usually don't peak until after the four-week moving average has hit a low for the cycle. You then get a recession about a year later. (Remember that this is all based off a tiny sample size so take it all with a big pinch of salt.)
The thing is, if the trough was 210,500 and we're now down to 217,250 suddenly it doesn't look as far-fetched that we might set a new low for this cycle. And if that's the case, then maybe the market hasn't yet peaked (the S&P 500's most recent high was around 2,950, which happened in October).
So I'm still not convinced despite my bearish tendencies that the current recession fear is going to turn out to be justified. I'll be keeping a very close eye on this employment indicator for the next few months.
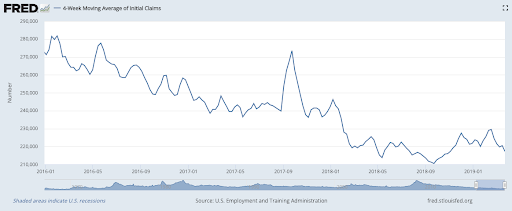
(US jobless claims, four-week moving average: since January 2016)
The oil price (as measured by Brent crude, the international/European benchmark) moved sideways this week.
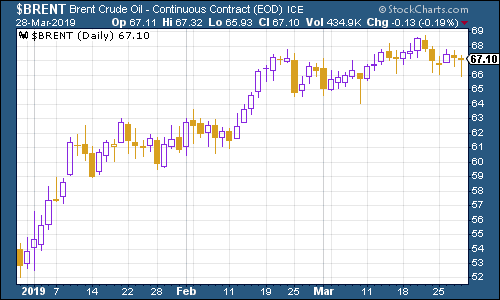
(Brent crude oil: three months)
Internet giant Amazon this week dropped back from the $1,800 mark. I've pulled the chart out a bit this week so you can see why I think this area is worth watching. I'm not a big user of technical analysis (charting). But it can give you a useful idea of market sentiment.
Right now it looks to me as though Amazon still has a good chance of revisiting its October highs. That $1,800-$1,850 level looks like a bit of "resistance" if it gets through that, I suspect that's a good sign for markets.
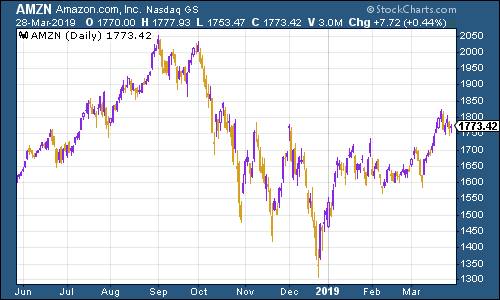
(Amazon: 10 months)
Electric-car group Tesla has rallied a little in the last week as Elon Musk has stayed out of the headlines.
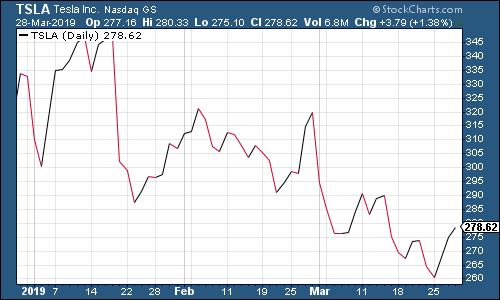
(Tesla: three months)
Have a great weekend.
Get the latest financial news, insights and expert analysis from our award-winning MoneyWeek team, to help you understand what really matters when it comes to your finances.

-
 Average UK house price reaches £300,000 for first time, Halifax says
While the average house price has topped £300k, regional disparities still remain, Halifax finds.
-
 Barings Emerging Europe trust bounces back from Russia woes
Barings Emerging Europe trust has added the Middle East and Africa to its mandate, delivering a strong recovery, says Max King