The charts that matter: Happy Lehman Brothers Day!
Ten years ago today, the financial crisis exploded onto the front pages. John Stepek looks at the charts that matter to find out what, if anything, has changed since then.

Get the latest financial news, insights and expert analysis from our award-winning MoneyWeek team, to help you understand what really matters when it comes to your finances.
You are now subscribed
Your newsletter sign-up was successful
Want to add more newsletters?

Twice daily
MoneyWeek
Get the latest financial news, insights and expert analysis from our award-winning MoneyWeek team, to help you understand what really matters when it comes to your finances.

Four times a week
Look After My Bills
Sign up to our free money-saving newsletter, filled with the latest news and expert advice to help you find the best tips and deals for managing your bills. Start saving today!
Welcome back and happy anniversary! Ten years ago today, Lehman Brothers filed for bankruptcy. The financial crisis exploded onto the front pages, as everyone finally realised that things were a lot worse than anyone had thought and that no one in authority had any idea of what they were doing.
This week, we've been trying to figure out what, if anything, has changed since then. In this week's chart-fest, we'll look back over ten years (eleven, mostly, in order to give more context to the pre- and post-Lehman worlds) rather than the usual three months, and see what perspective (if any) it sheds on what's happened since then.
If you missed any of this week's Money Mornings, here are the links you need.
MoneyWeek
Subscribe to MoneyWeek today and get your first six magazine issues absolutely FREE

Sign up to Money Morning
Don't miss the latest investment and personal finances news, market analysis, plus money-saving tips with our free twice-daily newsletter
Don't miss the latest investment and personal finances news, market analysis, plus money-saving tips with our free twice-daily newsletter
Monday: Ten years on: the biggest driver of the 2008 financial crisis has only got worse
Tuesday: Ten years on: what's changed? Are the banks less dangerous now?
Wednesday: Here's what the blockchain is for and when I think bitcoin will hit a bottom
Thursday: Ten years on: was it right to bail out the banks?
Friday: Ten years on: why did Lehman Brothers go bust?
The podcast will be back on Monday, with (hopefully) improved sound quality I'll let you know when the next one's up.
And as ever, don't miss this week's issue of MoneyWeek magazine! If you're not already a subscriber, sign up here now.
And now over to the charts.
As the chart below shows, gold (measured in dollar terms) took a hit along with every other asset during the 2008 crash, partly because it was liquid you could still sell it to raise cash, unlike lots of other assets. However, it bottomed out earlier than most assets, in November 2008 (the same went for most commodities, partly helped by Chinese massive stimulus package).
Gold then went on a tear until September 2011, when it peaked above $1,900 an ounce. By that point, eurozone fear had reached a peak. The same month, the Federal Reserve and the European Central Bank joined up with other global central banks to pump more liquidity into the system and (in effect) to promise to bail out the European banking system if necessary.
The fear in the headlines didn't go away, but it did start to dissipate in the markets. And in retrospect, that marked "peak catastrophe" as far as gold was concerned. Gold headed lower, and in 2013, with the majority of the eurozone crisis behind the markets and quarrels over the US debt ceiling also failing to fuel the narrative, it tanked to around $1,200 an ounce. And it's been trading within a pretty tight range even since, not going below $1,000 nor above $1,400.
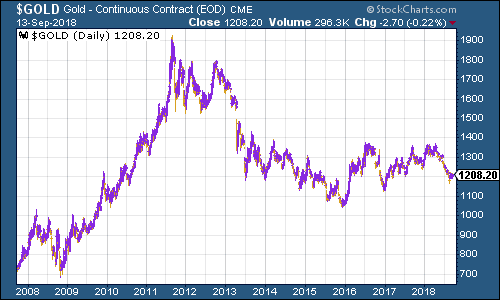
(Gold: 11 years)
The US dollar index a measure of the strength of the dollar against a basket of the currencies of its major trading partners had, prior to 2008, been pretty weak. The financial crisis changed that at first. US dollars became one of the top safe havens to hide in. Everybody wanted them.
However, aggressive quantitative easing (QE) and growing risk appetite saw the dollar hit hard (it's worth remembering that the biggest member of this basket is the euro, so to a great extent shifts in this index reflect the fortunes of the euro too).
The dollar hit rock bottom around May 2011, just before the second batch of QE money printing was about to end. Note that this is also when commodity markets pretty much topped out. The dollar then started to recover steadily, partly fuelled by the fact that the Bank of Japan announced its own massive QE in early 2013, offsetting the fact that in the US, QE3 had started in late 2012.
The dollar then took off in mid-2014, as Europe began to talk about printing money, sending the euro down hard, and also helped by the end of QE and the beginning of the "tapering" process.
The dollar saw its high at the start of 2017, after the election of Donald Trump saw markets betting on imminent reflation, and much higher interest rates. Then-Fed chief Janet Yellen consistently put off interest rate hikes, taking some strength out of the US currency, but new boy, Jerome Powell, has put a rocket back under the dollar.
We'll see what happens next, but it mostly depends on inflation and the knock-on effect on interest rates, as well as potential political interference from Trump.
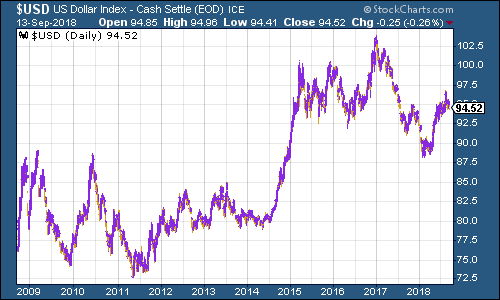
(DXY: ten years)
Like pretty much all government bonds, the Japanese ten-year government bond (JGB) yield spent almost all of its time after the financial crisis going down. And like most other government bonds, it hit rock bottom in the summer of 2016, as the panic over Britain voting to leave the EU saw a spasm of deflationary fear surge through markets. Since then, the JGB yield has risen, and the Bank of Japan has recently lifted the "cap" on the ten-year to 0.2%.
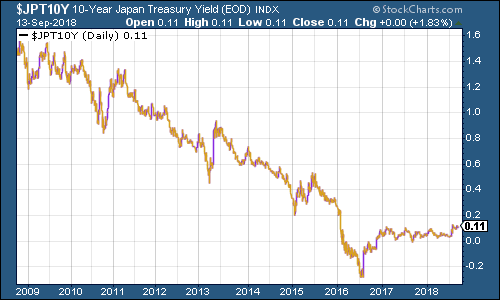
(Ten-year Japanese government bond yield: three months)
It's a similar story for the ten-year US Treasury bond. What's perhaps interesting about the US, though, is that while it fell hard, it never really approached the lows of its European or Japanese peers.
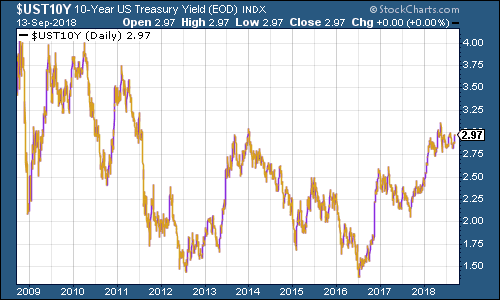
(Ten-year US Treasury yield: three months)
And it's the same again for the yield on the ten-year German bund (the borrowing cost of Germany's government, Europe's "risk-free" rate). Again it has rebounded strongly since mid-2016, but ongoing concerns over the eurozone (and the potential impact of trade wars on exports) have kept bund yields a little subdued of late.
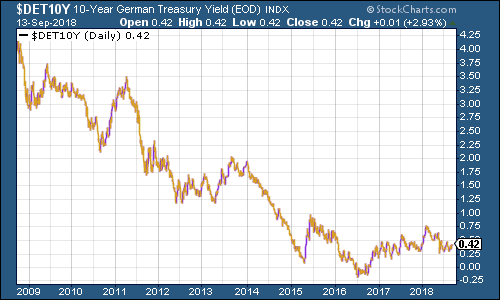
(Ten-year bund yield: three months)
Copper followed a similar pattern to most other commodities. It fell hard as global economic activity (and trade in particular) dried up after 2008. But it rallied just as hard as China's stimulus hit home, and investors started taking punts on emerging markets in preference to debt-hammered western countries.
It hit a peak in early 2011, coinciding with the trough in the dollar and also amid signs of a slowing Chinese economy. The bear market which ensued appears to have ended in 2016, at which point fears over another deflationary collapse were largely put behind us and global growth started to appear healthy all over again.
The more recent slide this year has been driven by concerns over trade, and also over China's growth.
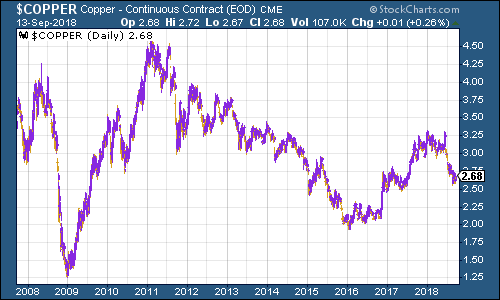
(Copper: three months)
In 2008, no one had heard of bitcoin or blockchains. But in October, just a month after the Lehman Brothers collapsed, Satoshi Nakamoto (the still-anonymous inventor of bitcoin) released the white paper that started it all to a small group of cryptography enthusiasts.
So, for the idealists and true believers out there, you can quite easily argue that the phoenix of the new financial system was almost literally born out of the ashes of the old one.
Of course, you could also argue that bitcoin is just a perfect example of the kind of thing that happens you get when interest rates at 0% and money printing by every major central bank in the world. It's either the future, or one of the purest examples of central bank-driven malinvestment the world has ever seen.
The chart below is on a log scale, by the way, because otherwise you can't really see how the price has changed over the time period. (I've included the standard version of the chart too, which illustrates the problem).
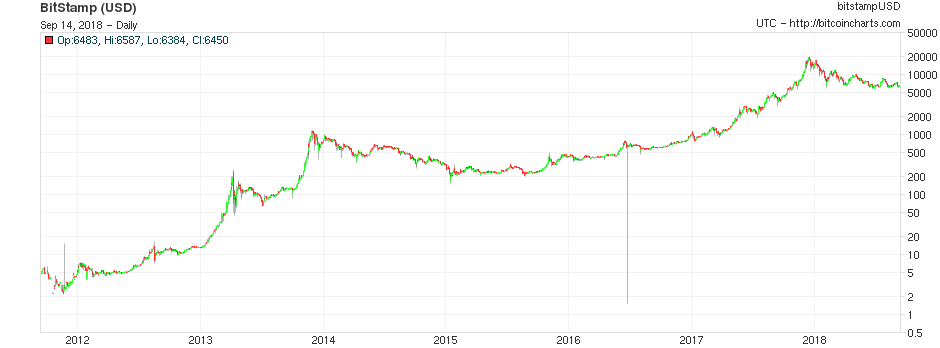
(Bitcoin: since 2011, log scale)
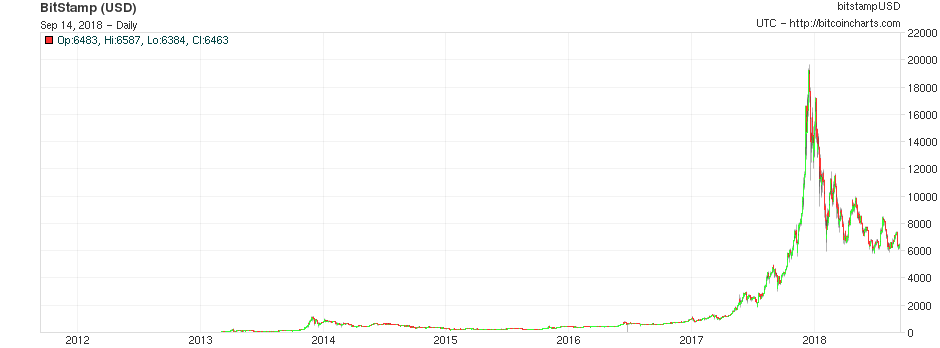
(Bitcoin: since 2011, linear scale)
On US employment, the four-week moving average of weekly US jobless claims fell back to another fresh cycle low of 208,000 this week (and the lowest level since December 1969), while weekly claims fell to 204,000 (last week's 203,000 reading was revised up to 205,000).
David Rosenberg of Gluskin Sheff has noted in the past, that when US jobless claims hit a fresh cyclical trough (as measured by the four-week moving average) as they have now, then a stockmarket peak is not far behind (on average 14 weeks although bear in mind this is an average of a very small number of fairly varied cycles), and a recession follows about a year later.
So we've now hit a new trough and, in line with Rosenberg's observations, we have seen the stockmarket continue to hit new highs. The S&P 500 is still above 2,900, above the previous all-time high it set in January this year, of 2,872.
Below, you can see the US jobless claims four-week moving average since around 2005. The grey bar represents a recession, which was already well in progress by the time Lehman went bust.
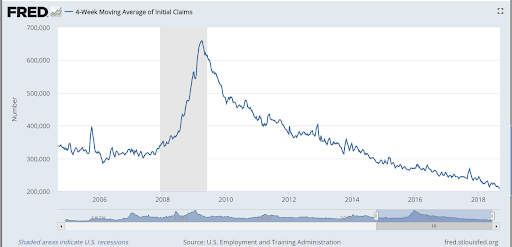
(US jobless claims, four-week moving average: since 2005)
The oil price (as measured by Brent crude, the international/European benchmark) followed a similar path to other commodities although there are some key differences. The 2008 crash saw oil prices collapse from over $140 a barrel to roughly $30, but then rebound rapidly. This was mainly because demand was choked off briefly, rather than because supply was too high.
The rebound carried prices back up above the $100 a barrel mark, and they stayed there for long enough for everyone to get used to it. And then of course, they fell. Fracking had introduced the US to the global oil market as a massive force.
A price war between Saudi-led Opec and the frackers in the US ended with Opec backing down in early 2016, but only after prices had crashed again. Since then, oil has been recovering and is now back up close to $80 a barrel.
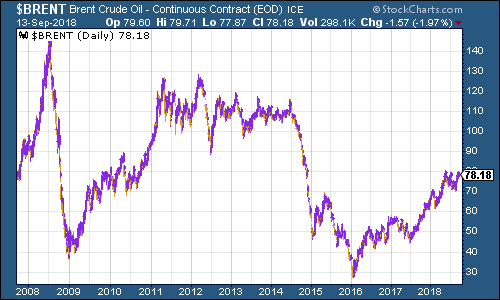
(Brent crude oil: 11 years)
Internet giant Amazon has just gone from strength to strength. I've done this one on a log scale too, and I've gone back 20 years, as it's instructive to see Amazon since the tech bubble and bust. Jeff Bezos's company is an extraordinary achievement, and a genuinely revolutionary force. Whether it's worth what it costs now is another matter, but people like me have been saying that all the way up.
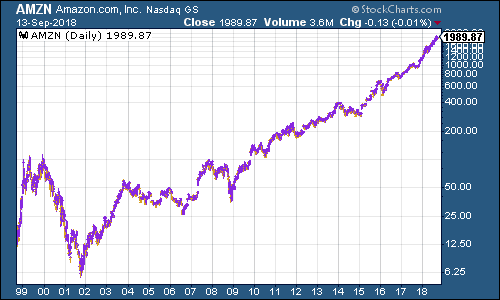
(Amazon: 20 years)
Electric car group Tesla didn't go public until well after Lehman Brothers went bust, listing in June 2010. However, it has been around for a while. It was founded in July 2003 and current CEO Elon Musk became chairman in 2004. The company has survived a number of near-death situations, including managing to raise funds in December 2008, just a few months after Lehman's collapse.
The share price rocketed in 2013 when the company reported its first ever profit and the Tesla Model S earned rave reviews from industry magazines. Basically, Elon Musk had proved that the company could compete in the luxury market. Now his challenge is to prove it can do the same in the mass market. Can he pull it off? The biggest risk is that he burns out or someone beats him to it or the funding backdrop he's enjoyed for years since the 2008 crash starts to become tighter.
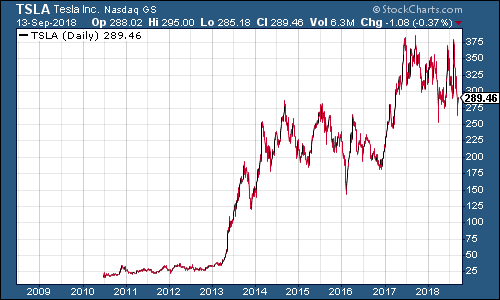
(Tesla: since listing in 2010)
Get the latest financial news, insights and expert analysis from our award-winning MoneyWeek team, to help you understand what really matters when it comes to your finances.

-
 How a dovish Federal Reserve could affect you
Trump’s pick for the US Federal Reserve is not so much of a yes-man as his rival, but interest rates will still come down quickly, says Cris Sholto Heaton
-
 New Federal Reserve chair Kevin Warsh has his work cut out
Opinion Kevin Warsh must make it clear that he, not Trump, is in charge at the Fed. If he doesn't, the US dollar and Treasury bills sell-off will start all over again