What do the charts tell us about what’s going on in the world right now?
John Stepek looks to his six charts that matter for clues to where the global economy is likely to be heading next.

Get the latest financial news, insights and expert analysis from our award-winning MoneyWeek team, to help you understand what really matters when it comes to your finances.
You are now subscribed
Your newsletter sign-up was successful
Want to add more newsletters?

Twice daily
MoneyWeek
Get the latest financial news, insights and expert analysis from our award-winning MoneyWeek team, to help you understand what really matters when it comes to your finances.

Four times a week
Look After My Bills
Sign up to our free money-saving newsletter, filled with the latest news and expert advice to help you find the best tips and deals for managing your bills. Start saving today!
Gold
on a bit of a roll. It has managed to climb back above the $1,300 an ounce mark and this time it's staying there.
There were two main factors driving the yellow metal this week. One was that the market took Federal Reserve chief Janet Yellen's total lack of comment on monetary policy at Jackson Hole as a fairly dovish sign.
The second was that US non-farm payrolls data came in weaker than expected on Friday. Just over 150,000 jobs were added compared to expectations for just under 190,000, and on top of that, wage inflation was weaker than expected. (Although not awful, at about 2.5%).
MoneyWeek
Subscribe to MoneyWeek today and get your first six magazine issues absolutely FREE

Sign up to Money Morning
Don't miss the latest investment and personal finances news, market analysis, plus money-saving tips with our free twice-daily newsletter
Don't miss the latest investment and personal finances news, market analysis, plus money-saving tips with our free twice-daily newsletter
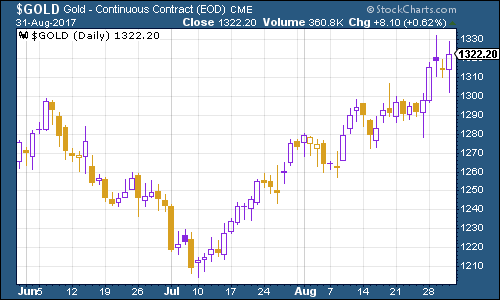
(Gold: three months)
The weak figures may or may not be reliable. Non-farm payrolls is a number that the market really gets excited about, and yet it's also revised constantly. Its market-moving power is therefore rather silly, but that's efficient markets for you.
Now that gold has managed to "break out" above the $1,300 mark quite decisively, all the technical bods (and there are a lot of them in gold) will probably get very excited and the "bias will be to the upside", as they say. As far as I'm concerned, gold rates a permanent place in your portfolio in any case, but this does also seem to be a point at which it might enjoy a bit of a bull run.
US dollar
The
index has struggled this week for pretty much the same reasons that gold has done well. However, I wouldn't necessarily bet on it all being one-way traffic (down the way) for the dollar from here.
Firstly, a lot of people are now bearish. At the start of the year, it felt likely that the dollar would fall because everyone was betting it would keep going up. Now everyone's betting it'll go down so it won't take much to send it back up.
Secondly and probably more importantly Mario Draghi, the boss of the European Central Bank, is getting fed up with the stronger euro. That's not what he wants to see and he's mounting an increasingly vigorous verbal campaign to talk the single currency down.
This matters for the dollar index specifically because the euro is the biggest component (the dollar index measures the dollar's value against a basket of the currencies of its biggest trading partners).
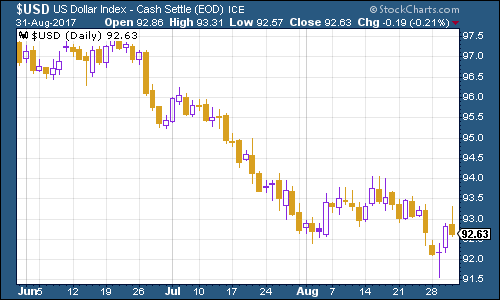
(DXY: three months)
Ten-year US Treasury bonds
The ten-year yield declined further. Investors are increasingly persuaded that the Fed will not raise interest rates soon and that inflation isn't about to take off either.
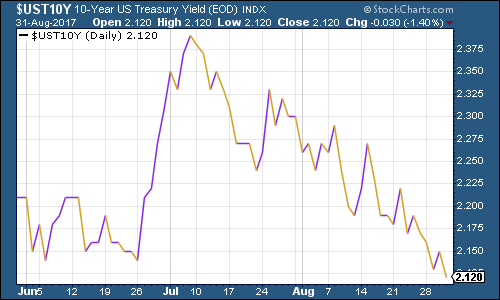
(10-year US Treasury: three months)
Copper
blistering run goes on. There are plenty of reasons for this there's the electric car mania which is more visible in lithium, but it's rubbing off on copper too. And there's the market in China picking up again, as John Authers pointed out recently in the FT.
I'm increasingly hearing mutterings that the rally has come too far, too fast, and looking at the chart, you can see why people might think that. Equally, the nerviness over the economy which is visible in the US ten-year yield does suggest a bit of a disconnect.
Then again, copper is coming out of a brutal five-year bear market. It might be due a breather, but equally I don't think it's overvalued.
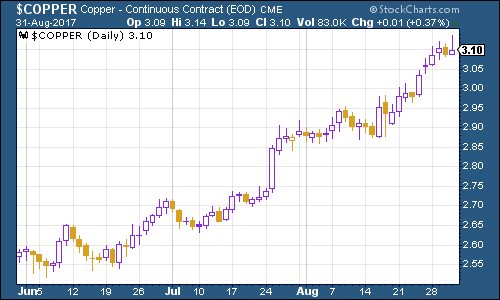
(Copper: three months)
Bitcoin
continues to impress and baffle me. Everyday I read something new about cryptocurrencies that makes me think "this must be the top". From Burger King Russia considering its own cryptocurrency to "shoeshine boy"-type stories about random strangers giving each other hot tips on the next digital currency to buy.
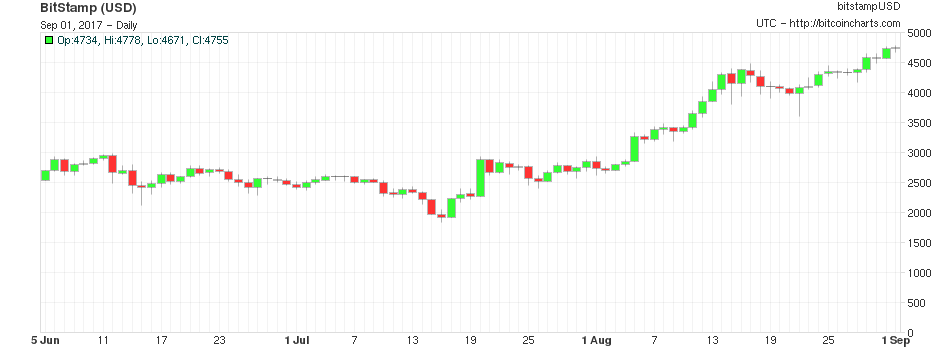
But up it goes. And now the banks are getting in on it too, apparently. Six of them have joined up to issue the "utility settlement coin" which is all about settling financial transactions without a central registry.
Again, I'm sceptical about most if not all of the cryptocurrencies out there, but I can see that eventually some useful applications will probably emerge. I'm not planning to pile in now though this is a bull market that will sail on without me.
US jobless claims
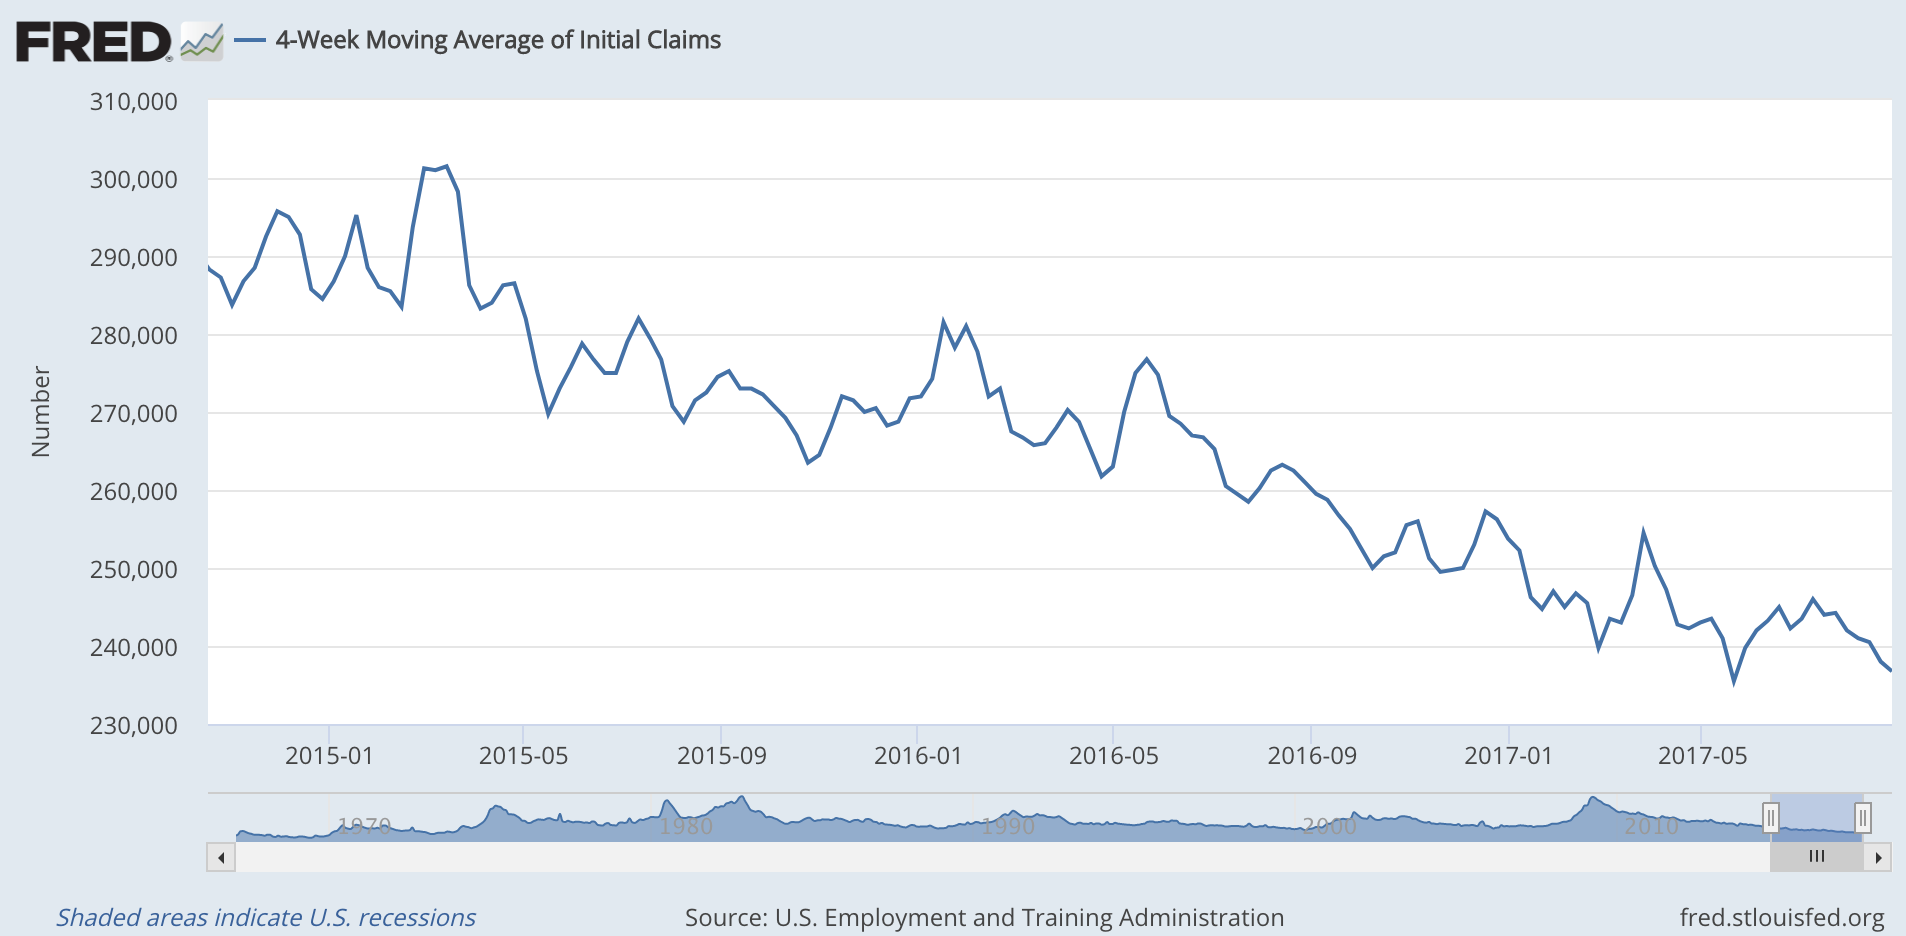
The weekly US jobless claims data continued to stay strong, even if the non-farm payrolls were mildly disappointing According to David Rosenberg of Gluskin Sheff, when this hits a "cyclical trough" (as measured by the four-week moving average), a stockmarket peak is not far behind (on average 14 weeks), and a recession follows about a year later.
This week, US jobless claims edged higher to 236,000. However, that's still extremely low by historic standards and the four-week moving average is now down at 236,750 not quite a new low, but really not far off the low of 235,500 set on 20 May.
If 20 May holds as the cyclical trough, then if Rosenberg is right (and to be fair, it's a small data set) we might already have seen the stockmarket peak. But that said, with jobless claims falling so sharply last week, I wouldn't yet want to bet against another low being made this year.
Oil price
Chart number seven is the
oil
(as measured by Brent crude, the international/European benchmark). Oil has edged higher again this week, though considering the hurricane disruption in Texas, the move does not amount to much.
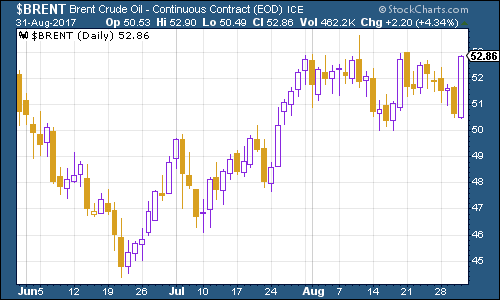
(Brent: three months)
Amazon
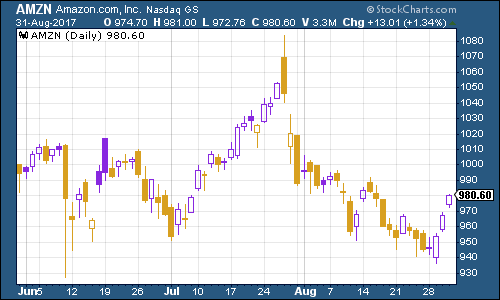
(Amazon: three months)
Finally there's Amazon. The tech giant has rallied along with the rest of the US market. It's amazing what hopes for a prolonged period of low interest rates can do for share prices.
Get the latest financial news, insights and expert analysis from our award-winning MoneyWeek team, to help you understand what really matters when it comes to your finances.

-
 Barings Emerging Europe trust bounces back from Russia woes
Barings Emerging Europe trust has added the Middle East and Africa to its mandate, delivering a strong recovery, says Max King
-
 How a dovish Federal Reserve could affect you
Trump’s pick for the US Federal Reserve is not so much of a yes-man as his rival, but interest rates will still come down quickly, says Cris Sholto Heaton