Get the latest financial news, insights and expert analysis from our award-winning MoneyWeek team, to help you understand what really matters when it comes to your finances.
You are now subscribed
Your newsletter sign-up was successful
Want to add more newsletters?

Twice daily
MoneyWeek
Get the latest financial news, insights and expert analysis from our award-winning MoneyWeek team, to help you understand what really matters when it comes to your finances.

Four times a week
Look After My Bills
Sign up to our free money-saving newsletter, filled with the latest news and expert advice to help you find the best tips and deals for managing your bills. Start saving today!
The past week was a good one for the precious metals. In terms of dollars, gold rose 4.6% on the week.
It scored new all-time (non-inflation adjusted) weekly closing highs against the US dollar, Chinese yuan, euro, Indian rupee and British pound. Gold is very close to making new all-time highs against the Australian dollar and Canadian dollar.
Silver also had a great week, making multi-decade highs against the major currencies. In terms of US dollars, it rose 5.4%, and hasn't been at this price since November 1980.
MoneyWeek
Subscribe to MoneyWeek today and get your first six magazine issues absolutely FREE

Sign up to Money Morning
Don't miss the latest investment and personal finances news, market analysis, plus money-saving tips with our free twice-daily newsletter
Don't miss the latest investment and personal finances news, market analysis, plus money-saving tips with our free twice-daily newsletter
Year-to-date gold has risen 13.2% in terms of US dollars, while silver has climbed a remarkable 21.8%.
It now takes 52.4 ounces of silver to purchase one ounce of gold, which is down from 56.4 ounces as of December 31st.
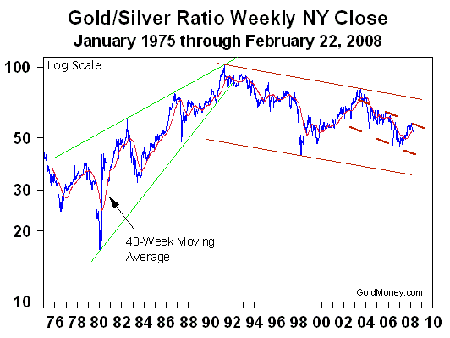
As we can see on the above chart, the gold/silver ratio has fallen below its 40-week moving average (currently at 53.9), which I mentioned as a possibility in the last alert. Given this important technical development, a further decline in the ratio can be expected. As long as silver continues to lead, it will confirm - as explained in the last alert - that the precious metals are in a bull market.
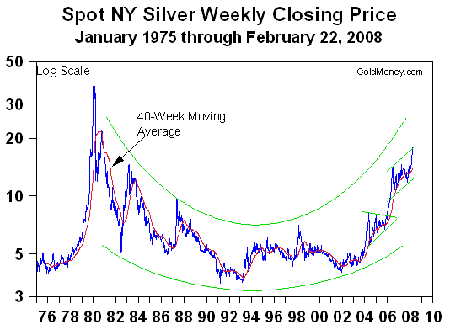
The above weekly chart of silver is important. Silver appears to be breaking out to the upside from a rising trend channel, which I regard as one of the most bullish technical patterns. Most consolidation patterns reflect downward price action, like the flag pattern (i.e., the parallel green lines) in the following gold chart.
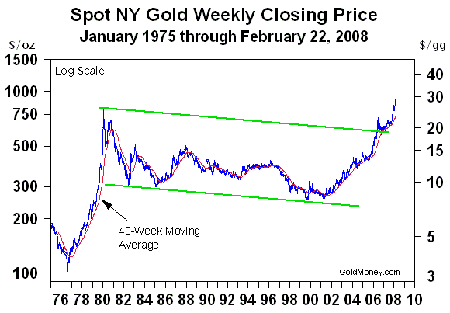
Sometimes prices move sideways during a consolidation, like the pennant formed from 2004-2006 in the above silver chart. A sideways pattern is stronger than a declining pattern because it reflects greater buying interest, and hence more buying power.
Carrying this logic further, a rising consolidation pattern is stronger still. It shows that buyers are not willing to wait for pullbacks to previous price levels. They instead buy at rising prices, which is what the rising trend channel in the above silver chart reflects.
The physical silver market is experiencing intense buying interest, and we are seeing that buying power in silver's price pattern - and not only in US dollars. Look at the following daily chart of silver in terms of British pounds.
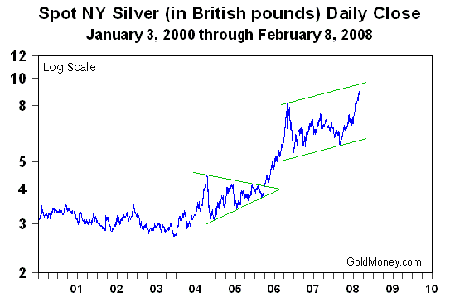
We again see a rising trend channel, although silver has not yet broken out to the upside. Given that the dollar remains the weakest currency, it is to be expected that silver would break out first against the dollar. The British pound is the next weakest currency, so if the breakout against the dollar is confirmed in the days immediately ahead by following through with further price gains, a breakout against the pound would probably be next, with the euro following soon thereafter.
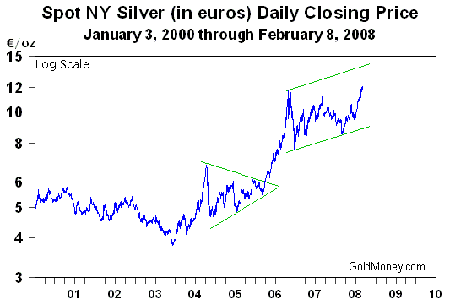
Clearly, the precious metals are now in the 'powerful rally' that I mentioned in the last alert. But the natural question is whether this rally will continue.
No one of course can predict the future, but as I have been saying in these alerts all along, undervalued assets eventually become fully valued and in some cases, even overvalued. Gold and silver remain undervalued, so whether this current rally climbs further in the weeks ahead is largely irrelevant. Gold and silver will continue to climb over the long-term until at some future date they become fully valued, and we are a long way from that moment.
James Turk is the Founder & Chairman of GoldMoney.com. He is the co-author of The Coming Collapse of the Dollar.
Get the latest financial news, insights and expert analysis from our award-winning MoneyWeek team, to help you understand what really matters when it comes to your finances.
MoneyWeek is written by a team of experienced and award-winning journalists, plus expert columnists. As well as daily digital news and features, MoneyWeek also publishes a weekly magazine, covering investing and personal finance. From share tips, pensions, gold to practical investment tips - we provide a round-up to help you make money and keep it.
-
 UK interest rates live: experts expect MPC to hold rates
The Bank of England’s Monetary Policy Committee (MPC) meets today to decide UK interest rates. The last meeting resulted in a cut, but experts think there is little chance of interest rates falling today.
-
 MoneyWeek Talks: The funds to choose in 2026
Podcast Fidelity's Tom Stevenson reveals his top three funds for 2026 for your ISA or self-invested personal pension

