How high can gold go?
The price of gold continues to reach new highs. But October is traditionally a bad month for gold, and we are due a sell-off at some point. So what should investors do? Dominic Frisby explores how far gold's bull run could go, and whether you should buy more, sit tight or sell.
Get the latest financial news, insights and expert analysis from our award-winning MoneyWeek team, to help you understand what really matters when it comes to your finances.
You are now subscribed
Your newsletter sign-up was successful
Want to add more newsletters?

Twice daily
MoneyWeek
Get the latest financial news, insights and expert analysis from our award-winning MoneyWeek team, to help you understand what really matters when it comes to your finances.

Four times a week
Look After My Bills
Sign up to our free money-saving newsletter, filled with the latest news and expert advice to help you find the best tips and deals for managing your bills. Start saving today!
Gold climbed to another all-time high yesterday of $1,068 an ounce, before closing at $1,063. Goldbugs unsurprisingly are very excited.
But a correction will come. It always does. The question is: "When?"
Should you be taking on new positions now? Should you be sitting tight? Or should you be selling?
MoneyWeek
Subscribe to MoneyWeek today and get your first six magazine issues absolutely FREE

Sign up to Money Morning
Don't miss the latest investment and personal finances news, market analysis, plus money-saving tips with our free twice-daily newsletter
Don't miss the latest investment and personal finances news, market analysis, plus money-saving tips with our free twice-daily newsletter
Today, I wanted to venture a few thoughts as to how high gold could go on this run. So let's try to answer some of those questions...
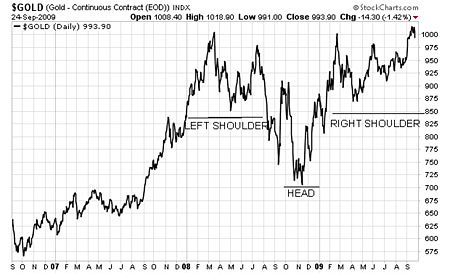
A number of technical analysts have been commenting this past year on the massive inverted head-and-shoulders pattern that has been building up in gold over the last year. This is a bullish chart pattern and usually comes at the end of a downtrend, indicating a reversal. It is rare, but nevertheless bullish to see it in an uptrend, as was the case with gold.

How high could gold go from here?
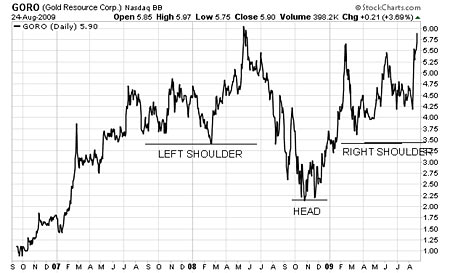
In order to see what is possible from such a formation when it breaks out, I ask you to look at this chart of junior gold miner Gold Resource Corporation (US: GORO). As you can see, by late-August it had made a virtually identical pattern to that of gold.

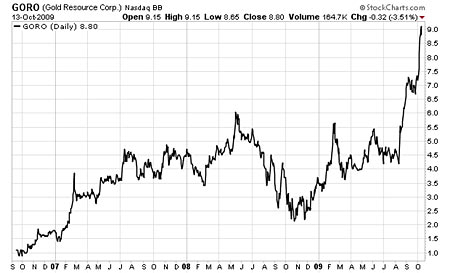
Then it broke out, quickly launching from $4.25 to $9.

Those last two charts look as though they are for two different companies, so significant has been the impact of the break-out. But it is the same company viewed just six weeks later.
Gold Resource Corp is an excellent company and has long been doing excellent work. It's one of the top if not the top companies in its class. But this was not unknown. Yet suddenly now that it's shifting, everyone wants a piece of it.
Gold is not dissimilar. Most market participants have an inkling as to why you should own gold. But not everyone does own it. As gold breaks out, suddenly there is a rush to buy.
I am not saying gold will double from here like Gold Resource Corporation. It's nothing like as volatile or as leveraged as a junior miner. But I am just showing what is possible from this head-and-shoulders set-up. Gold has broken out to new highs and, technically, there is no overhead resistance to stand in its way.
Beware the October correction
So how high will it go?
Bear in mind that October is a bad month for gold. Almost every year we get a nasty seasonal sell-off some time in October. That hasn't come yet and is due. A correction in stock markets would also take gold down.

- Why UK property prices are going to fall 50%
- When it will be time to get back in and buy up half price property
I have frequently commented that gold has a tendency to make up-moves that last some six to nine months and then consolidate for a year to 18 months. I believe we are a couple of months in to such an up-move. But even in these up-moves there are still nasty falls.
Looking at the 2007-08 move, gold rose from a summer low of $650 in August 2007 to $1,030 in March 2008 roughly a 60% move. There were a couple of stalls in October, but the first major correction did not come until November 2007. By then gold had moved from $650 to $850, a 30% move. Then there was a 10% correction.
Looking further back to the 2005-6 move, gold rose 70% from a summer low of $420 to $730 in May the following year. After a choppy October, its first major correction, also of 10%, came in December 2005. By then gold had moved from $420 to $540, also a 30% rise.
Let's use these previous moves as a template for the current move. The starting point was the summer low of $905 made in early July. A 30% move would take us to $1,200. So there's an argument that, even with a choppy October, we could see $1,200 before Christmas. But we'll also get the nasty 10% correction.
A 60% move from the summer low of $905 takes us to $1,448. A 70% move gives us to $1,538.
Of course, I reserve the right to change my mind as events unfold. It does not do any investor any favours to become too wedded to any single theory. But these are my targets for this move in gold. I always like to issue a disclaimer and today's is that rather too many commentators are noticing this biennial up-move pattern I have described. If too many people know about it, that might invalidate it.
Hold on to gold
But for now, I believe investors should hold on and enjoy the bumpy ride. There are some gold stocks that have shot up, while others have lagged. Traders might consider taking some profits on their winners and hunting out some laggards that have yet to move. (Explorers, which tend to move more, but later in the run, are starting to look very attractive now I'll have more on this next week). And those without any gold should buy some physical, even at these high prices. What do they say? 'Buy gold and wait. Don't wait and buy gold.'
Our recommended article for today
Gloomy times ahead for China
China faces a major slowdown in the growth of its economy: investment spending is losing its momentum and won't be replaced by consumer spending. Martin Spring examines why.
Get the latest financial news, insights and expert analysis from our award-winning MoneyWeek team, to help you understand what really matters when it comes to your finances.
MoneyWeek is written by a team of experienced and award-winning journalists, plus expert columnists. As well as daily digital news and features, MoneyWeek also publishes a weekly magazine, covering investing and personal finance. From share tips, pensions, gold to practical investment tips - we provide a round-up to help you make money and keep it.
-
 Average UK house price reaches £300,000 for first time, Halifax says
While the average house price has topped £300k, regional disparities still remain, Halifax finds.
-
 Barings Emerging Europe trust bounces back from Russia woes
Barings Emerging Europe trust has added the Middle East and Africa to its mandate, delivering a strong recovery, says Max King

