The most important tool in your trading toolkit
Bengt Saelensminde reveals the most important investment tool he uses, with a detailed explanation as to how you can use it to make a new trade on the FTSE.
Get the latest financial news, insights and expert analysis from our award-winning MoneyWeek team, to help you understand what really matters when it comes to your finances.
You are now subscribed
Your newsletter sign-up was successful
Want to add more newsletters?

Twice daily
MoneyWeek
Get the latest financial news, insights and expert analysis from our award-winning MoneyWeek team, to help you understand what really matters when it comes to your finances.

Four times a week
Look After My Bills
Sign up to our free money-saving newsletter, filled with the latest news and expert advice to help you find the best tips and deals for managing your bills. Start saving today!
A Eurozone debt crisis, Libyan rebels on the rampage, Saudis stirring up stuff in Bahrain... what more could go wrong? Errrm... nuclear Armageddon in Japan...
What's an investor supposed to do?
Well, I have some ideas. Let me show you where I'm going from here.
MoneyWeek
Subscribe to MoneyWeek today and get your first six magazine issues absolutely FREE

Sign up to Money Morning
Don't miss the latest investment and personal finances news, market analysis, plus money-saving tips with our free twice-daily newsletter
Don't miss the latest investment and personal finances news, market analysis, plus money-saving tips with our free twice-daily newsletter
Shall we turn left, or right?
Last week I put forward a trade to profit from the FTSE's range-bound performance. I said that global turmoil would give us the volatility we wanted to keep the FTSE bouncing around.
The thinking was that we should profit from the FTSE's ups and downs, so long as she hovered around the 6000 mark. But boy, I didn't know what was about to hit us...
No sooner had I put my ideas down and sent them to you, than the market came along and bit me on the backside. Sure, we got the volatility. But then the market headed off on a frolic of its own...
This should convince you of the value of stop losses
If you entered this FTSE position, it should have been automatically closed out. And frankly, that was good news. After we were stopped out' at 5800, the FTSE carried on tanking... even dropping under 5600 at one stage.
That's worth thinking about. If you hadn't had a stop loss in place, you would have been getting calls from your spread betting company demanding more margin' deposit to keep the position running...
That's the beauty of a stop loss. When you place a trade with a stop loss, you know the downside. You should always be comfortable with that before you trade. And the stop loss cuts out the pain' at that level in the event of a nasty surprise. It really is about the most important tool in your trading toolkit.
Anyway, now we're out of the trade.
But we're in a dilemma. Should we keep on trading for the uplift, or accept that the markets have gone the wrong way?
I think there's still merit in my strategy. After all, how can you argue with buy low, sell high?'
For the brave, things look even better today. I outlined on Wednesday why I reckon there's a good chance markets will bounce straight back.
So I'm going to carry on with my strategy. As with the original trade, you should keep your position manageable. You must go into the trade knowing that your stop loss could get hit. Last week, our stop loss was 150 points below the open (5950). So, for example, at £10 a point, that's a £1,500 hit - which is why I suggested trading smaller. But the amount is up to you, your comfort zone and the depths of your pocket.
Any trader will suffer losses, so make sure you only stake what you can afford to lose. That way, you'll be able to get back into the trade when it's more favourable - and that's what I'm proposing today.
But if you've been shaken by the last trade, I wouldn't blame you if you want to sit this one out - it'll probably indicate that your position size was too big. In fact, if the markets make you feel a little bit queasy, then maybe you should watch from the sidelines - or trade with a lower stake.
But I think our trading is about to get exciting... there's a chance we can profit from this volatility.

Your FREE oil report: The 3 best ways to play the coming oil supply crunch right now!
- Discover how to profit from oil without ever owning a single barrel
- Why NOW is the best time to put a few carefully selected oil investments into your portfolio
How we're going to fine-tune our strategy
Here's the trade we talked about last week...
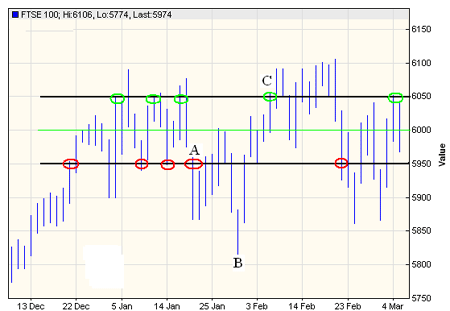
I said that with the FTSE bouncing around the 6000 level, and with a nice bit of volatility, there was an easy buy low & sell high' game on.
FTSE 100 HL 3-month chart

Buy the red circles and sell the greens was the strategy.
Of course this grand plan' got blown straight out of the water. And now we're in un-charted territory. We're outside the range.
Frankly we don't know where the market is going now. Are we in a resumption of the 2007 bear market? Or is it just a bear phase of this new bull?
Well, I've kind of given my hand away. I reckon the markets want to go up. I've come to terms with the new global fed' policy on stock markets. They have to go up!
And with that in mind I want to show you a couple of ways to buy into this fed-induced bull market...
Stay with the Fed and buy the dips
Last week I suggested an arbitrary buy-in' level at 5950. Now the problem we've already seen is that the market may try to find a new level - and it could be a lot lower than its previous trading range.
So I think what we're going to need is a more mobile buy-in' point.
Rather than using a fixed entry and exit point (like my buy at 5950, sell at 6050), we can use some technical wizardry to come up with a more dynamic system.
Today, I want to show you a tool I like to use called Bollinger bands'.
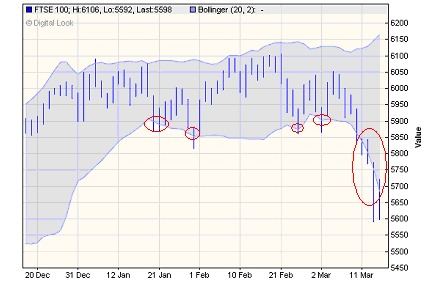
3-month FTSE 100 with Bollinger bands

Take a look at the chart. The shaded area you can see shows 2 standard deviations from the 20-day moving average of the share price.
The way to think about it is that the shaded area tells us where a share (or index) should trade 95% of the time. So if we stray outside the shaded area, then we should buy the lows and sell the highs.
The problem is that on this chart our price movements don't move much outside of the bollinger bands. Looking back at the last 3 months, we've only had buy signals (red circles) - we wouldn't have had the signal to close out our trade (the green circles we saw in the previous chart). There's been no way of taking profits!
So we need something else. I'm going to introduce you to one more thing today that can help us with that problem. It's the thirty-day moving average.
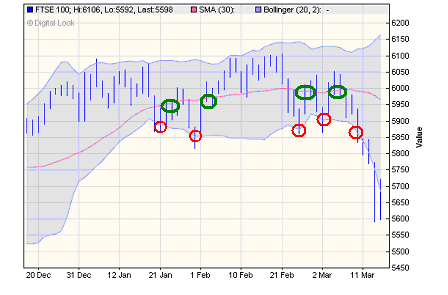
3-month FTSE 100 with Bollinger bands and 30-day MA

As its name suggests, a 30-day moving average (30-day MA) is the average closing price over the last 30 days. It's the red line that neatly runs through the heart of the bollinger bands on the chart above.
I'm suggesting that we buy when the price heads outside the lower bollinger band (red circles) and sell when we hit the 30-day MA (the green circles).
The chart is telling us that today the FTSE 100 is a buy. The problem is, it's been giving us a buy signal ever since the 5850 level. As with last week's trade, our stop loss would have got hit even using these bollinger bands.
It just goes to show, no trading system is perfect. No matter how sophisticated the system, when the markets don't go the way you expect, you're going to get hit.
That's why I can't stress enough the importance of the stop loss. It has to be low enough to ensure you don't get needlessly shaken out of the trade. But it must be realistically set to ensure that you don't get scalped if you're on the wrong side of the trade.
That's why I'm sticking with a 150 point stop loss.
As I write, the FTSE is at 5715. If the FTSE can reach back up to its 30-day MA, we could be on for a 200+ point gain. I can't say for certain, because the 30-day MA changes all the time. If the market carries on falling, the MA will fall and profits (if any) will be lower. And if the market falls by 150 we'll be stopped out again.
As with my (failed!) trade last week, the success of this strategy depends on the FTSE bouncing back to some semblance of normality. I'm depending on what I dubbed the FTSE's yoyo mojo and the global Feds' willingness to throw money at their perceived problem.
Judging by yesterday's trading, there's life in the FTSE yet. By my reckoning the Feds want to get this show back on the road. So the FTSE should be heading higher.
If you want to take part in this trade, you can place an up-bet on the FTSE 100 using a spread-bet. Or you could simply buy a FTSE ETF. The bollinger bands suggest that anything below 5800 looks a good bet.
But beware, with this technical trading, we don't know exactly when to sell...
A moving average is a moving target - you'll need to keep an eye on the chart to see when the market gets back in line.
You can include bollinger bands on most online charting packages. Your spread betting platform may well allow this facility. I know mine with IG Index does. Or just use DigitalLook as I have for the charts above.
[By the way, if you're looking for a spread betting account, there's a handy comparison page with lots of good incentive deals right here on the MoneyWeek website]
I'll give you some updates on this trade as we move along too. Just remember, fortune favours the bold. But as ever, only trade with money you can afford to lose. And always use a stop loss.
As I write the FTSE is trading at 5725. If you open at that level, you should place your stop loss at 5575. That means your losses will be capped at 150 points multiplied by your stake.
With the 30-day MA drifting towards 5950, I would anticipate closing out for a 225 point profit if things go well. We'll just have to keep an eye on that chart and be ready to have our nerve tested.
By the way, The Right Side isn't turning into a trading service. I'll continue to bring you the ideas I see on any form of investing. I just happen to think now is a great time to be looking for short-term index trades. Next week, I'll have some new ideas altogether for you.
But if trading really is your thing, I've got another great tool for you. My colleague John Burford has recently started a free e-letter called MoneyWeek Trader. It should be exactly what you're looking for - and he looks at Forex, stocks, commodities like gold and oil... anything you can trade! And John's got a wealth of technical trading knowledge - I urge you to tap into it.
Just add your name to his list here.
Until Monday,
MoneyWeek Trader is an unregulated product published by MoneyWeek Ltd
Important Information
Spread betting is not suitable for everyone - ensure you fully understand the risks involved and never risk more than you can afford to lose. Spread betting carries a high level of risk to your capital. Prices can move rapidly against you and resulting losses may be more than your original stake or deposit. Margin amounts vary between spread betting companies and the type of markets spread bet.
Commissions, fees and other charges can reduce returns from investments. Profits from share dealing are a form of income and subject to taxation. Tax treatment depends on individual circumstances and may be subject to change in the future. Please note that there will be no follow up to recommendations in The Right Side.
Managing Editor: Frank Hemsley. The Right Side is issued by MoneyWeek Ltd.
MoneyWeek Ltd is authorised and regulated by the Financial Services Authority. FSA No 509798. https://www.fsa.gov.uk/register/home.do
This article was first published in the free investment email The Right side. Sign up to TheRightSide here.
Get the latest financial news, insights and expert analysis from our award-winning MoneyWeek team, to help you understand what really matters when it comes to your finances.
Bengt graduated from Reading University in 1994 and followed up with a master's degree in business economics.
He started stock market investing at the age of 13, and this eventually led to a job in the City of London in 1995. He started on a bond desk at Cantor Fitzgerald and ended up running a desk at stockbroker's Cazenove.
Bengt left the City in 2000 to start up his own import and beauty products business which he still runs today.
-
 Can mining stocks deliver golden gains?
With gold and silver prices having outperformed the stock markets last year, mining stocks can be an effective, if volatile, means of gaining exposure
-
 8 ways the ‘sandwich generation’ can protect wealth
People squeezed between caring for ageing parents and adult children or younger grandchildren – known as the ‘sandwich generation’ – are at risk of neglecting their own financial planning. Here’s how to protect yourself and your loved ones’ wealth.