What does the p/e ratio really tell you?
The price/earnings ratio (p/e) is among the most popular methods of rating a stock. It's easy to see why: it's quick and simple to use. But how useful is it really? Tim Bennett explains.
Get the latest financial news, insights and expert analysis from our award-winning MoneyWeek team, to help you understand what really matters when it comes to your finances.
You are now subscribed
Your newsletter sign-up was successful
Want to add more newsletters?

Twice daily
MoneyWeek
Get the latest financial news, insights and expert analysis from our award-winning MoneyWeek team, to help you understand what really matters when it comes to your finances.

Four times a week
Look After My Bills
Sign up to our free money-saving newsletter, filled with the latest news and expert advice to help you find the best tips and deals for managing your bills. Start saving today!
The price/earnings ratio (p/e) is among the most popular methods of rating a stock. It's easy to see why: it's quick and simple to use. But how useful is it really?
The basic concept
The p/e's simplicity is also a pitfall. The 'historic' p/e takes today's share price and compares it to the past 12 months' earnings per share (EPS) after tax. So a price of £2.20 and EPS of 10p (one year's earnings divided by the number of shares in issue) gives a p/e of 22. The higher the p/e, the more costly the share in earnings terms. The FTSE 100 average is around ten, so you need good reason to buy a FTSE 100 share on a p/e of 22.
But this is the first trap. A low p/e of five might represent a bargain very crudely (and ignoring inflation) it suggests it will only take you five years to get back the money you spend on the share. But the p/e might also be low because the market doubts earnings can be sustained. In other words, a low p/e compared to its sector or index may just mean that a share isn't worth buying.
MoneyWeek
Subscribe to MoneyWeek today and get your first six magazine issues absolutely FREE

Sign up to Money Morning
Don't miss the latest investment and personal finances news, market analysis, plus money-saving tips with our free twice-daily newsletter
Don't miss the latest investment and personal finances news, market analysis, plus money-saving tips with our free twice-daily newsletter
Variations on the theme
Other drawbacks are that the classic p/e uses last year's earnings figure, and it also only looks at one year, a problem when earnings are volatile and if a firm is losing money, the p/e is useless. You can use a 'forward' p/e, which compares the current share price to expected earnings for the next 12 months. The snag is that you need a reliable forecast, and the credit crunch has made earnings very hard to predict. Morgan Stanley's Graham Secker believes things are improving in defensive sectors such as aerospace and pharma, but the outlook is still murky in others, such as banking and property.
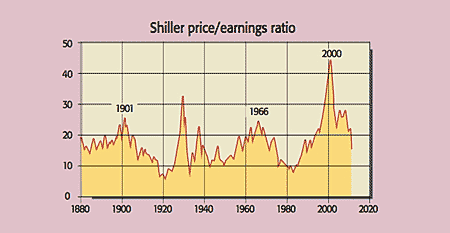
Another option is to use Yale professor Richard Shiller's p/e ratio, which tries to adjust for swings in profitability. Rather than look at one year's earnings, Shiller averages the last ten. But even this is no panacea. As the FT's David Stevenson notes, "it's quite obvious that [the Shiller p/e] can vary significantly over time" (see graph). Today the US market is trading at close to its 130-year average Shiller p/e of around 16.

But whether you think US shares are still worth buying depends on your view of the US economy. Many, such as new Bank of England Monetary Policy Committee member Andrew Posen, expect the second half of a 'double dip' or W-shaped economic growth (GDP) to arise. As such, US shares are no longer a bargain after the recent bounce.
There's no 'magic number'
If you could get rich using one number, we'd all be doing it. A better approach is to use several and look for a pattern. There are three particularly useful ones.
The price/book ratio the share price compared to the firm's balance sheet net assets per share is good in asset-intensive sectors, such as telecoms and property. The lower the better, as this indicates you're not paying a whopping premium to buy the firm's assets.
Next, price/free-cash-flow. This is a measure of cash generated from operating activities, after deducting interest on debt, the tax bill, and the spending (capex) needed to keep the business going (analysts often deduct a year's depreciation as a proxy for this). Again, the lower the better.
Finally, the dividend yield. Having to pay a dividend focuses managers on generating regular cash flow. The FTSE 100 average yield is just under 5%, so anything above that is a good sign as long as cover (the ratio of profit before dividends to the ordinary dividend) is two or above.
A useful alternative: EV/Ebitda
Some believe the p/e is also mechanically flawed. Earnings are distorted by accounting adjustments. Subjective decisions about how long 'fixed' assets, such as buildings and plant, will last result in big hits to profit for 'depreciation' or 'amortisation'. Earnings before interest, tax, depreciation and amortisation (Ebitda) strips these out.
Critics also argue that a share price only reflects the equity capital in a business. By using enterprise value (EV) a firm's debt and equity you create a ratio relevant to all of a firm's external investors. So if a firm's debt is £50m and its market capitalisation is £200m, EV is £250m. If Ebitda is £26m, then EV/Ebitda is £250m/£26m or about 9.6 times, which can be compared to rivals or the market as a whole.
But EV/Ebitda suffers many similar limitations to p/e it's also based on a single year's earnings, and is still useless if a firm is loss-making. To counter the latter problem, some investors rank firms using the price, or EV, to sales ratio the lower the multiple, the cheaper the firm. But to be frank, if a sector cannot generate positive earnings, or Ebitda (or free cash flow, which Ebitda is a proxy for), then we'd steer clear altogether.
Get the latest financial news, insights and expert analysis from our award-winning MoneyWeek team, to help you understand what really matters when it comes to your finances.
Tim graduated with a history degree from Cambridge University in 1989 and, after a year of travelling, joined the financial services firm Ernst and Young in 1990, qualifying as a chartered accountant in 1994.
He then moved into financial markets training, designing and running a variety of courses at graduate level and beyond for a range of organisations including the Securities and Investment Institute and UBS. He joined MoneyWeek in 2007.
-
 Average income tax by area: The parts of the UK paying the most tax mapped
The UK’s total income tax bill was £240.7 billion 2022/23, but the tax burden is not spread equally around the country. We look at the towns and boroughs that have the highest average income tax bill.
-
 BBC TV licence fee hike confirmed: can you reduce how much you pay?
The cost of a TV licence fee is set to rise by over 3%, but there are ways to reduce the bill.