Get the latest financial news, insights and expert analysis from our award-winning MoneyWeek team, to help you understand what really matters when it comes to your finances.
You are now subscribed
Your newsletter sign-up was successful
Want to add more newsletters?

Twice daily
MoneyWeek
Get the latest financial news, insights and expert analysis from our award-winning MoneyWeek team, to help you understand what really matters when it comes to your finances.

Four times a week
Look After My Bills
Sign up to our free money-saving newsletter, filled with the latest news and expert advice to help you find the best tips and deals for managing your bills. Start saving today!
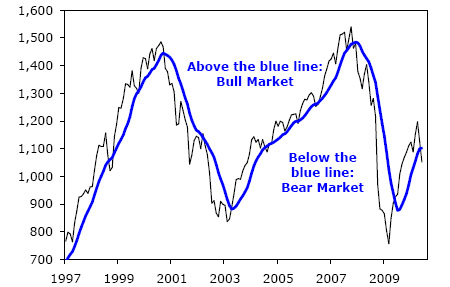
I don't know why everyone doesn't get it. Take a look at the chart below. When the stocks are above the blue line, it's a bull market, and you want to own stocks. When stocks are below the blue line, it's a bear market.
Is that hard to get?
If you'd followed an investment strategy based on this simple idea, your portfolio would have beaten the best fund managers in the world. Even better, it would have taken you only two hours a year to follow (just ten minutes a month).
MoneyWeek
Subscribe to MoneyWeek today and get your first six magazine issues absolutely FREE

Sign up to Money Morning
Don't miss the latest investment and personal finances news, market analysis, plus money-saving tips with our free twice-daily newsletter
Don't miss the latest investment and personal finances news, market analysis, plus money-saving tips with our free twice-daily newsletter
Since the start of that chart above, the main stock market index (the S&P 500) has risen 4% per year. If you'd bought when the stock market was below the blue line, you'd have lost money at a rate of over 11% per year. If you'd bought when the stock market was above the blue line, you'd have made a 12% profit per year not including dividends.
Since bull markets are longer than bear markets, you'd be "in" about two-thirds of the time and "out" one-third of the time.

This little system works even if you look further back. I ran the numbers going back to the early 1970s. And the results are similar. Stocks rise 12% a year when they're above the blue line. And you lose money when stocks are below the line. Also, similarly, you're "in" stocks about two thirds of the time. So the strategy has worked for 40 years at least.

- Why UK property prices are going to fall 50%
- When it will be time to get back in and buy up half price property
This "blue line strategy" is nothing fancy by the way. It's the ten-month moving average of the S&P 500 index. You just take the closing prices of the stock market at the end of the each of the last ten months and average them. If the current price is above the average, you buy. If it is below the average, you step aside.
There's nothing special about the ten-month average. This system works with the eight-month average, nine-month average, 11-month average whatever. It's not far off from the 40-week average or the 200-day average. These are typical things that traders look at.
My point is, I'm not doing some sort of mathematical gymnastics. It is simple.
I'm bringing this little strategy up today because important things are happening with it right now.
For the last year, stocks have been above the blue line. We've been in a bull market. But that appears to be ending right now. If June ended today (as I assumed in the chart above), the stock market would be below the line and it would be time to be "out".
The great thing about this strategy is the blue line doesn't care about housing bubbles, wars, dot-com booms and busts, or government spending. The blue line does no analysis at all.
With the blue line strategy, you spend two hours a year (ten minutes a month to calculate the average), and you beat the stuffing out of the best fund managers in the world.
The blue line strategy has only issued two recommendations since late 2006. It said "sell" stocks back in 2007. And it said "buy" in mid-2009.
Don't you wish you would have ignored everyone and everything else in that time and simply gone with the blue line strategy?
After a year of saying "buy stocks" if things stay as they are, the blue line strategy looks like at the end of this month it could be issuing its first "sell" recommendation since 2007. The blue line strategy has a great track record. What are you gonna do?
This article was written by Dr. Steve Sjuggerud for the free daily investment email DailyWealth
Get the latest financial news, insights and expert analysis from our award-winning MoneyWeek team, to help you understand what really matters when it comes to your finances.
MoneyWeek is written by a team of experienced and award-winning journalists, plus expert columnists. As well as daily digital news and features, MoneyWeek also publishes a weekly magazine, covering investing and personal finance. From share tips, pensions, gold to practical investment tips - we provide a round-up to help you make money and keep it.
-
 Average UK house price reaches £300,000 for first time, Halifax says
While the average house price has topped £300k, regional disparities still remain, Halifax finds.
-
 Barings Emerging Europe trust bounces back from Russia woes
Barings Emerging Europe trust has added the Middle East and Africa to its mandate, delivering a strong recovery, says Max King

