Will today’s results crush Apple?
It seemed Apple could do no wrong. But that was last summer and now many analysts have changed their tune. Are they right? John C Burford looks to the charts to find out.
Get the latest financial news, insights and expert analysis from our award-winning MoneyWeek team, to help you understand what really matters when it comes to your finances.
You are now subscribed
Your newsletter sign-up was successful
Want to add more newsletters?

Twice daily
MoneyWeek
Get the latest financial news, insights and expert analysis from our award-winning MoneyWeek team, to help you understand what really matters when it comes to your finances.

Four times a week
Look After My Bills
Sign up to our free money-saving newsletter, filled with the latest news and expert advice to help you find the best tips and deals for managing your bills. Start saving today!
Wonder-company Apple has been a terrific market for my trading methods since last year. Today I will show you how I used my methods on Apple, and how you can use them profitably in many individual shares - as opposed tothe stock indexes, such as the Dow.
Who has not heard of Apple? Maybe a few Martians, but the ubiquitous company has been responsible for the worldwide rise of smart mobile phones with the famous iPhone leading the way.
But this device now has serious competition for the first time, and many are negative on the share.
MoneyWeek
Subscribe to MoneyWeek today and get your first six magazine issues absolutely FREE

Sign up to Money Morning
Don't miss the latest investment and personal finances news, market analysis, plus money-saving tips with our free twice-daily newsletter
Don't miss the latest investment and personal finances news, market analysis, plus money-saving tips with our free twice-daily newsletter
Let's back up to last year when I first started following it.
(Click on the chart for a larger version)
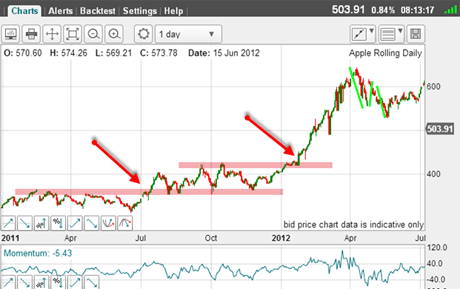
In 2011, the share price consolidated up to the summer, and then broke above the resistance area shown by my first pink bar. The classic entry was at the first red arrow in the $350 region.
The rest of the year was spent consolidating that gain, and then it made a similar move above resistance (upper pink bar), and another entry was indicated (second red arrow) in the $430 area.
By now, the market was showing the classic signs of a bull market with higher highs and higher lows.
It then entered a manic phase! The run-up to the $650 area was very swift.
As we all know, such exponential runs are not sustainable, and the market fell back to correct the overbought condition.
Of course, it is almost impossible to predict when and where the turn will come before the event. As traders say, "Never try to pick tops or bottoms".
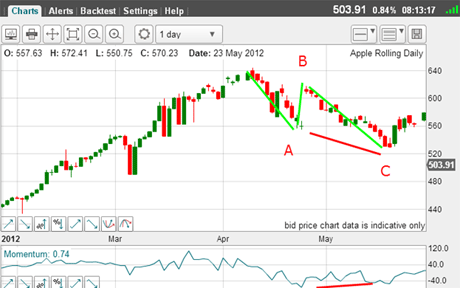
The market came off the high in three clear waves and with a positive-momentum divergence at the C wave low. Here is a close-up:
(Click on the chart for a larger version)
That was the signal to buy again near the C wave low.
One method I sometimes use to enter in this situation is this: towards the C wave low, the market was making new lows every day (red candles). Then, we had our first green (up) candle.
My entry method is to place a buy order just above the high of the previous day and adjust it downwards every day until I get a fill. The likelihood is that I have caught the actual C wave low and can expect a resumption of the main trend (up).
The C wave low was the low of the corrective move and the market moved smartly back up and made new highs and hit the $700 level.
(Click on the chart for a larger version)
It was then that the bullish chorus was at its loudest!
Satisfying
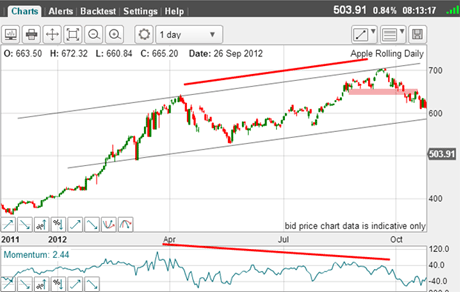
But as it hit the $700 level, I noted a big warning sign there was a massive negative-momentum divergence forming (red bars). If the market could not rally swiftly towards $1,000 - and so eliminate this divergence, the odds would favour a decline.
My line in the sand was the pink bar the previous minor lows. If this support could be broken, the odds for a decline would really rise and disappoint the bulls.
I confess I do get satisfaction when I can do this! That's the competitiveness in me. I have to call it what it is a bias, something traders shouldn't indulge.
With the possible (at this stage) top at $700, I could draw in possible tramlines the upper one connecting the two major tops, and the lower one connecting some major lows.
Let's see how it developed:
(Click on the chart for a larger version)
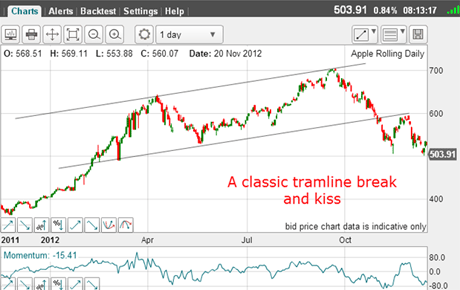
The market broke the tramline convincingly, then came back for a classic kiss.
That was another fine entry point for a short trade!
So now, we are carrying two short positions one in the $660 area and the other around $580.
Where next for Apple?
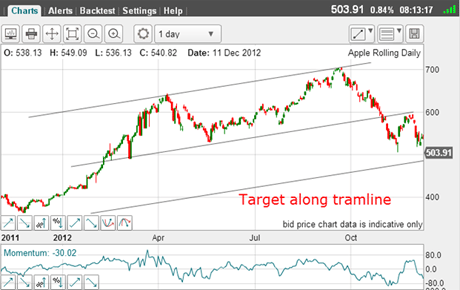
So where is my target?
Time to draw in my third lower tramline:
(Click on the chart for a larger version)
And here it is, showing my price target around $480 along the tramline.
So, let's fast forward to today:
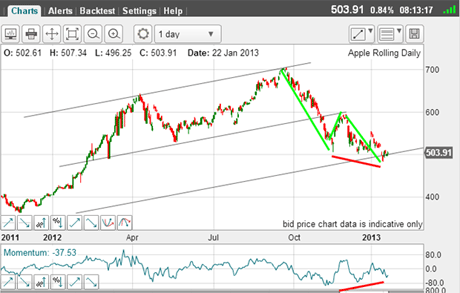
(Click on the chart for a larger version)
Bull's eye! Last Tuesday, the market hit a low of $483 right on my lower tramline.
That is where profits were taken for a very nice trade made possible by the simple application of my methods. And incidentally, without any notice taken of the reams of commentary on the company and its products.
In fact, if I did not know I was trading Apple, it could have been almost anything. And it would have made no difference to the end result!
So what is the picture as I gaze at the chart?
I note the clear A-B-C down to the $480 level (green bars) and the clear positive-momentum divergence (red bars) at current levels.
This is the mirror-image of the set-up at the tops!
Time to look for a long trade, methinks.
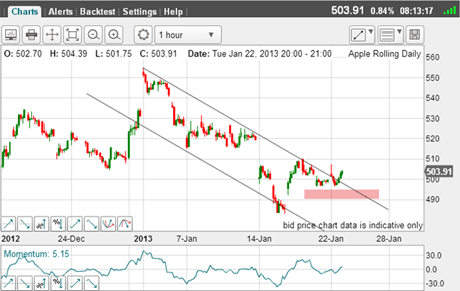
Here is the hourly chart:
(Click on the chart for a larger version)
The market has gapped up off the $480 low, has moved back down to test this gap, and yesterday has broken above my tramline. It's heading for the other gap just above the $510 level.
This tramline break appears genuine to me, and so I have a long position with aprotective stop in the pink zone below the most recent minor lows.
Remember, the major trend is still up and that is the way to trade most of the time.
Later today, Apple will release its latest results. Many are predicting dire things. The mood music has turned very negative on Apple not surprising after the $220 fall off the September $700 high a decline of over 30%.
Remember, the news follows the markets!
Many are citing the death in 2011 of Steve Jobs, who turned the company around and created a monster cash cow, as well as the strong competition now appearing. They believe the best is over.
We shall see.
If you're a new reader, or need a reminder about some of the methods I refer to in my trades, then do have a look at my introductory videos:
The essentials of tramline trading
An introduction to Elliott wave theory
Advanced trading with Elliott waves
Don't miss my next trading insight. To receive all my spread betting blog posts by email, as soon as I've written them, just sign up here . If you have any queries regarding MoneyWeek Trader, please contact us here.
Get the latest financial news, insights and expert analysis from our award-winning MoneyWeek team, to help you understand what really matters when it comes to your finances.
John is is a British-born lapsed PhD physicist, who previously worked for Nasa on the Mars exploration team. He is a former commodity trading advisor with the US Commodities Futures Trading Commission, and worked in a boutique futures house in California in the 1980s.
He was a partner in one of the first futures newsletter advisory services, based in Washington DC, specialising in pork bellies and currencies. John is primarily a chart-reading trader, having cut his trading teeth in the days before PCs.
As well as his work in the financial world, he has launched, run and sold several 'real' businesses producing 'real' products.
-
 Pension Credit: should the mixed-age couples rule be scrapped?
The mixed-age couples rule was introduced in May 2019 to reserve pension credit for older households but a charity warns it is unfair
-
 Average income tax by area: The parts of the UK paying the most tax mapped
The UK’s total income tax bill was £240.7 billion 2022/23, but the tax burden is not spread equally around the country. We look at the towns and boroughs that have the highest average income tax bill.