Will the Nikkei be a star performer in 2014?
Many traders will be hoping for another great year in Japanese stocks. Will they be disappointed? John C Burford examines the charts.
Get the latest financial news, insights and expert analysis from our award-winning MoneyWeek team, to help you understand what really matters when it comes to your finances.
You are now subscribed
Your newsletter sign-up was successful
Want to add more newsletters?

Twice daily
MoneyWeek
Get the latest financial news, insights and expert analysis from our award-winning MoneyWeek team, to help you understand what really matters when it comes to your finances.

Four times a week
Look After My Bills
Sign up to our free money-saving newsletter, filled with the latest news and expert advice to help you find the best tips and deals for managing your bills. Start saving today!
I'm going a little off piste today. I normally cover the Dow, because it's my favourite stock index to swing trade. But today I shall analyse the Nikkei, which appears to be on the verge of a turn. It could also be at a major turning point.
One reason for my interest is that Japanese stocks have become a highly touted sector for investors lately. 2013 was certainly a banner year for Japanese shares. The problem for overseas investors is not the booming stock market. The problem is that the yen has been similarly booming, but in the wrong direction.
Is the Japanese market finally going up?
However, if the investor had been fully hedged, the result would have been a much more palatable 50% or so. Let's hope the UK-based Japan unit trusts were so hedged!
MoneyWeek
Subscribe to MoneyWeek today and get your first six magazine issues absolutely FREE

Sign up to Money Morning
Don't miss the latest investment and personal finances news, market analysis, plus money-saving tips with our free twice-daily newsletter
Don't miss the latest investment and personal finances news, market analysis, plus money-saving tips with our free twice-daily newsletter
During last year, comments on the Nikkei were increasingly bullish, and in some cases, very bullish. After many false dawns over the years, pundits were asking: was Japan's market finally getting up off its knees and following the US markets upwards?
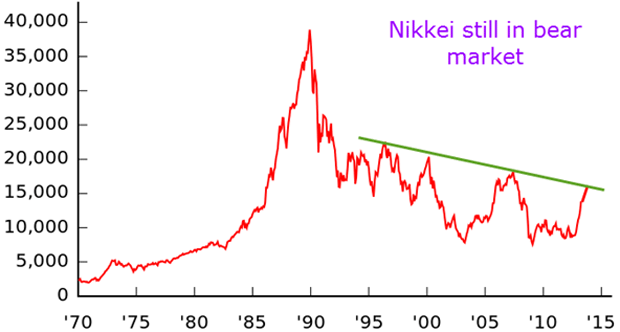
Market veterans recall the mania surrounding Japanese stocks in the 1980s. That was when the Nikkei finally hit an incredible 40,000. But since the peak in 1990, it has been downhill all the way, with occasional bear market rallies (those were the false dawns). Here is the chart:

Note the downtrend line joining the major highs that spans over 20 years. If history is any guide (and it usually is), this is a very strong line of resistance that should repel a major advance from here. That is a major piece of information.
Using history as an indicator

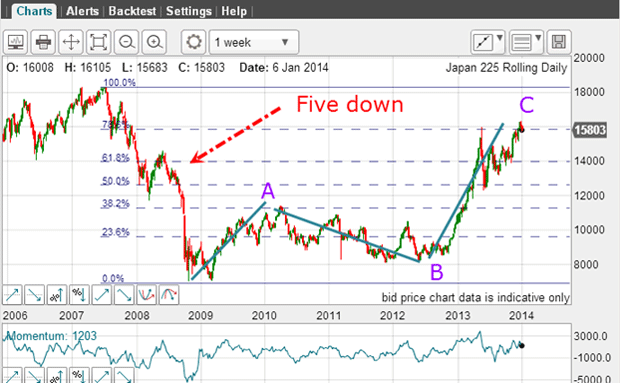
The Nikkei suffered a fate similar to all other global stock indexes during the crash of 2007 2009 by plunging over 50% from the top. But the impulsive decline was in a clear five waves, taking it in the same downward direction as the main trend (see top chart).
At the 2009 lows, note the huge positive-momentum divergence. That was a clear signal that a turn was near.
After a five wave move, Elliot wave theory (EWT) maintains that a corrective rally in the form of an A-B-C (or variation) should appear. And that is precisely what we have with the C wave currently sitting on the Fibonacci 78% retrace of the five wave down move. Now this is getting interesting!
Bull markets make investing geniuses

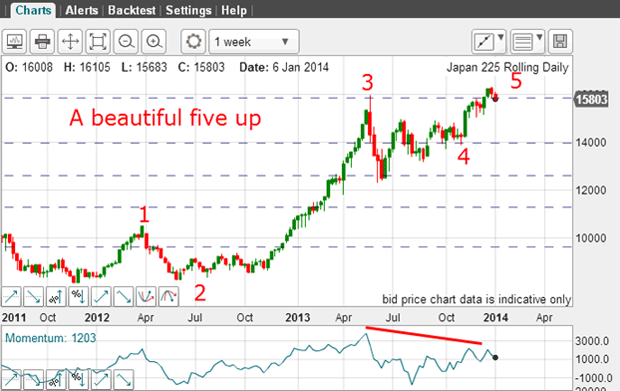
On this daily chart, I have a textbook impulsive five waves up. The third wave is very long and strong with only three red candles in all of its length in the main section! That is about as strong a third wave as I have ever seen on a daily chart.
The rally was relentless. Naturally, this performance only increased the ardour of the bulls towards their positions. Remember, markets make opinions and bull markets make investing geniuses (at least they are until the market turns).
But look at the fourth wave it is a classic converging triangle, which acts like a coiled spring. The breakout of the triangle is like the spring's sudden unwinding where the market zooms up out of it. But note that the momentum of this fifth wave falls well short of the maximum levels reached in the third wave. This is a textbook warning sign that the fifth wave is likely at or near the end of its journey.
Another Japanese earthquake looms
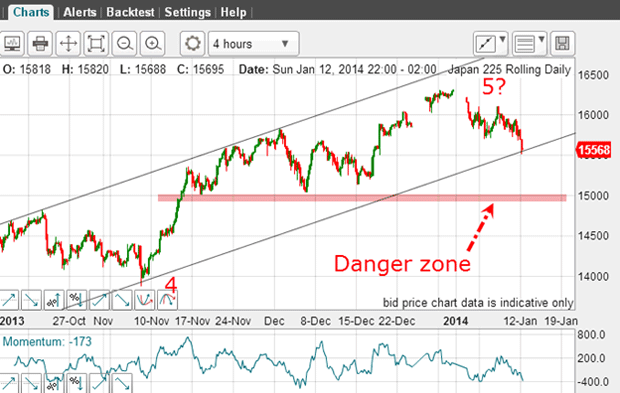
And here is the hourly chart:

I have a decent (but not superb) tramline pair and the market is currently testing my lower tramline. This is the moment of truth in the short-term. If the market breaks down here and enters chart support in the danger zone, the odds would swing heavily towards a bearish outcome.
Alternatively, the market could bounce from here and make a new high. So far, wave 5 is in only three waves which lie between the tramlines. Ideally, I would like to see five sub-waves within this fifth wave to complete before having confidence the new down trend had started. The potential remains for a new high.
But this morning, the Nikkei bull market appears to be on shaky ground and another earthquake in Japan looms.
Get the latest financial news, insights and expert analysis from our award-winning MoneyWeek team, to help you understand what really matters when it comes to your finances.
John is is a British-born lapsed PhD physicist, who previously worked for Nasa on the Mars exploration team. He is a former commodity trading advisor with the US Commodities Futures Trading Commission, and worked in a boutique futures house in California in the 1980s.
He was a partner in one of the first futures newsletter advisory services, based in Washington DC, specialising in pork bellies and currencies. John is primarily a chart-reading trader, having cut his trading teeth in the days before PCs.
As well as his work in the financial world, he has launched, run and sold several 'real' businesses producing 'real' products.
-
 Average UK house price reaches £300,000 for first time, Halifax says
While the average house price has topped £300k, regional disparities still remain, Halifax finds.
-
 Barings Emerging Europe trust bounces back from Russia woes
Barings Emerging Europe trust has added the Middle East and Africa to its mandate, delivering a strong recovery, says Max King