Will crude rally to the $36 area in the next few days?
With everyone so bearish on oil, the market is bound to rise. John C Burford uses Elliott wave theory to find out when.
Get the latest financial news, insights and expert analysis from our award-winning MoneyWeek team, to help you understand what really matters when it comes to your finances.
You are now subscribed
Your newsletter sign-up was successful
Want to add more newsletters?

Twice daily
MoneyWeek
Get the latest financial news, insights and expert analysis from our award-winning MoneyWeek team, to help you understand what really matters when it comes to your finances.

Four times a week
Look After My Bills
Sign up to our free money-saving newsletter, filled with the latest news and expert advice to help you find the best tips and deals for managing your bills. Start saving today!
While filling the tank of my car last week, I chatted to the service station manager about where he thinks fuel prices are heading. This was my sneaky way of taking the sentiment reading of the oil market. Yes, a sample of one is hardly scientific, but what he said was revealing. He believed retail prices will continue lower in fact, he was ordered to drop prices that morning by a penny.
Immediately, I wondered if he was gripped by 'recency bias' a well-known phenomenon championed by most economists and pundits (and money managers). When under its spell, your view is skewed by the recent trend. Oil prices have headed lower, so you will tend to believe the trend will continue.
That is the safe and lazy way of thinking and conforms with the herd's mentality. Moving with the herd is the safe option, career-wise (even when wrong). When you are out on a limb and get it wrong, all bets for your career are off.
MoneyWeek
Subscribe to MoneyWeek today and get your first six magazine issues absolutely FREE

Sign up to Money Morning
Don't miss the latest investment and personal finances news, market analysis, plus money-saving tips with our free twice-daily newsletter
Don't miss the latest investment and personal finances news, market analysis, plus money-saving tips with our free twice-daily newsletter
But operators who are fully independent and have no party line to toe (there are very few of us who appear in the media), can use this information as contrary indicators to advantage. Many times in these posts,I have pointed to a major trend change based on a lop-sided state of sentiment.
I am not claiming that my service station chat was the key factor in turning the crude oil market around, but last week saw a significant weekly key reversal (a new low and a close above the previous week's low) that indicates that the trend has now changed.
And with speculators at a record number of bearish bets (Commitments of traders (COT) data), the scene is now set for the massive short squeeze that I have been expecting.
But how can that be? Surely there is no logical 'reason' for oil prices to rise? There is the newly on-stream supply of Iranian oil, the massive build-up of oil stocks with tankers circling the globe unable to land, and the pledged full-on Saudi supplies.
The other big bearish story is the 'green' revolution in energy. Prominent stories have recently emerged that the (unsubsidised) cost of solar and wind energy production are now at a similar level to that of oil. If so, then oil prices surely cannot rise? And now electric cars are about to take over which would crimp oil demand even further.
That is the conventional view that the media has focused on. But we know that they are in the business of finding rationales for trends already well in place.
When crude was trading at $140 almost two years ago, did anyone take their eyes off the looming 'peak oil' story (remember that?) to look at the possibility that demand would flatten out in a low-growth world, or that booming US shale oil output would make the US a leading producer again?
No, the pundits are unable to see the seeds of a bull market's destruction. And that the very same process is at work today, only it is the bear market that will be destroyed.
Incidentally, we are seeing the same dynamic playing out in stocks with 'peak debt' the driving force.
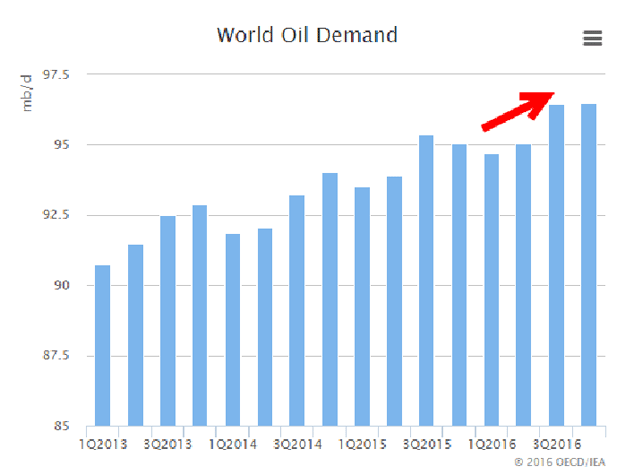
But today, what about the other side of the coin oil demand? This factor is mostly ignored by the media as it focuses on the more dramatic supply stories. This is the International Energy Agency's forecast with recent history:

(Source: OECD)
They forecast demand rising to a record high into late 2016 from its current dip. Is this a market in perpetual decline as so many believe? I think not.
If this forecast is correct, then it would not take a great deal of reduction in stockpiles (and perhaps a constriction in supply?) to get the market worried about supplies again. Needless to say, that sentiment would put a rocket under oil prices this year. And that is my likely scenario for later this year.
But of course, it is one thing to get the direction of trend right. It is another to get your timing right. As all traders know, it is entirely possible to be right and still lose money (with wrong timing).
The crude market is now showing very interesting patterns that indicate a major low is at hand. I will show you what I mean with the use of basic Elliott wave theory.
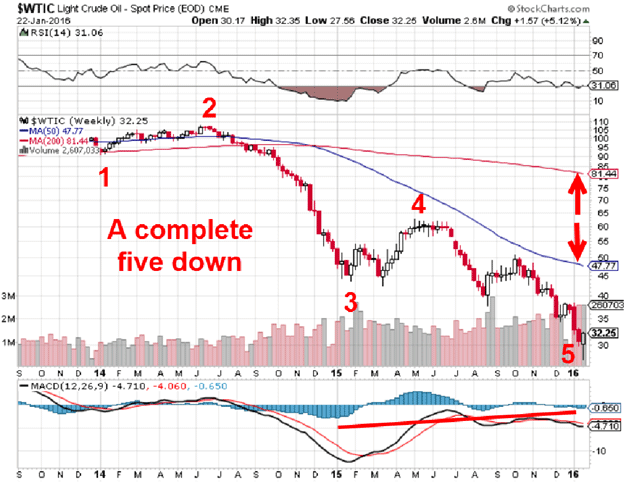
Here is the weekly chart of West Texas Intermediate (WTI) crude:

Last week's key reversal candle is white (an up week) and there is a massive divergence in the MACD (Moving average convergence divergence). Not only that, but the separation of the 50-week and 200-week moving averages is extreme (red arrows).
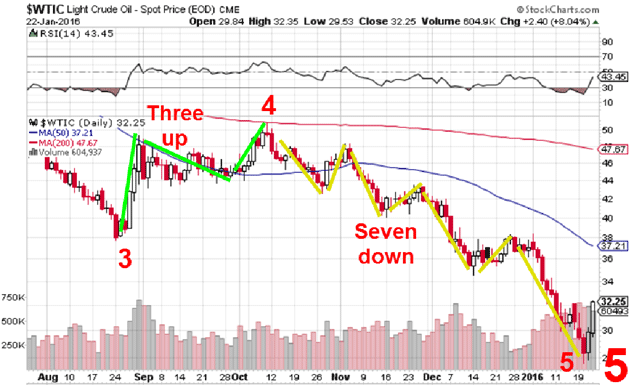
In addition, this wave 5 from last May to last week consists of its own set of waves and there are seven so far:

In Elliott wave theory, a motive wave only completes when there are five or nine waves (actually a nine waver is a variant of a five). If this is the correct interpretation, there is one more up and down sequence before the ultimate low is reached.
But because of the lop-sided bearish sentiment (in fact, the Daily Sentiment Index (DSI) remains well under the 10% bulls level), the current rally could extend some distance before the excess bearish sentiment is corrected in a short squeeze.
The bottom line? I expect this current rally to end and the downtrend to resume to the final low below the $28 level.
But how high could this current rally go?
That is a good question! In two days, it has moved up by over $4. Could it possibly reach the 50-day moving average at the $36 area before reversing? To be more confident, I need to see an A-B-C on the hourly chart and that has not yet formed as of this morning.
And finally, as a laughable example of my headline indicator at work, I came across this one in the weekend personal finance section: "Pick a manager who'll sink with you".
I almost fell off my chair when I read the sub-head: "Amid such market carnage, it can be reassuring to know the person running your fund is invested in it and is feeling the same pain".
So not only must the captain go down with his ship, but the whole crew and even all the passengers! The lifeboats are still hanging there, empty. Now that's what I call herding in extremis.
Get the latest financial news, insights and expert analysis from our award-winning MoneyWeek team, to help you understand what really matters when it comes to your finances.
John is is a British-born lapsed PhD physicist, who previously worked for Nasa on the Mars exploration team. He is a former commodity trading advisor with the US Commodities Futures Trading Commission, and worked in a boutique futures house in California in the 1980s.
He was a partner in one of the first futures newsletter advisory services, based in Washington DC, specialising in pork bellies and currencies. John is primarily a chart-reading trader, having cut his trading teeth in the days before PCs.
As well as his work in the financial world, he has launched, run and sold several 'real' businesses producing 'real' products.
-
 ISA fund and trust picks for every type of investor – which could work for you?
Whether you’re an ISA investor seeking reliable returns, looking to add a bit more risk to your portfolio or are new to investing, MoneyWeek asked the experts for funds and investment trusts you could consider in 2026
-
 The most popular fund sectors of 2025 as investor outflows continue
It was another difficult year for fund inflows but there are signs that investors are returning to the financial markets