Which way will gold turn next?
After spending the last month in a wide trading range, gold could be about to break out. John C Burford examines the charts to see which way gold might be heading next.
Get the latest financial news, insights and expert analysis from our award-winning MoneyWeek team, to help you understand what really matters when it comes to your finances.
You are now subscribed
Your newsletter sign-up was successful
Want to add more newsletters?

Twice daily
MoneyWeek
Get the latest financial news, insights and expert analysis from our award-winning MoneyWeek team, to help you understand what really matters when it comes to your finances.

Four times a week
Look After My Bills
Sign up to our free money-saving newsletter, filled with the latest news and expert advice to help you find the best tips and deals for managing your bills. Start saving today!
When I last covered gold a little over a week ago: A great gold trade, I identified a tidy short-term short trade based on a tramline break (a favourite theme of mine).
Since then, the market has traded in a wide range, but has yet to move towards challenging the $1,540 an ounce low that I have been expecting.
In the meantime, gold has offered me two other short-term trades based on tramline breaks one a short trade and one a long trade.
MoneyWeek
Subscribe to MoneyWeek today and get your first six magazine issues absolutely FREE

Sign up to Money Morning
Don't miss the latest investment and personal finances news, market analysis, plus money-saving tips with our free twice-daily newsletter
Don't miss the latest investment and personal finances news, market analysis, plus money-saving tips with our free twice-daily newsletter
Trading tip: If you are a short-term trader looking to trade market swings, you will be looking for both long and short trades. You need to be 'agnostic' in your basic view of the market. We know that most people are bullish gold. That means most will find it extremely difficult emotionally to short the market. I am long-term bearish gold, but will gladly take a long trade if presented.
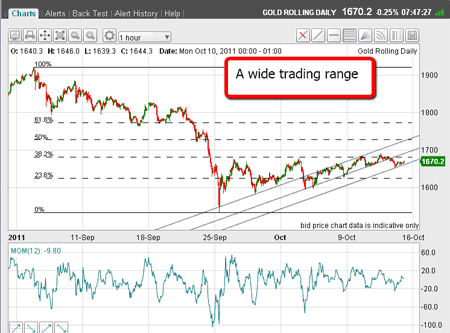
OK, here is the chart showing the wide trading range since the low of 26 September:

(Click on the chart for a larger version)
I have drawn in the Fibonacci retrace levels using the $1,920 high and the recent low as pivot points. These are the most significant recent reversal points.
If you have not seen how I use Fibonacci theory, watch my video tutorial: Trading with Fibonacci levels.
The market is meeting strong resistance
Note that all rallies have been stopped by the huge resistance put up by the 38% level.
Now, if the market can push above this resistance, the move will very likely be sharp, as there will be masses of buy-stops in this region.
These buy-stops belong to the growing army of gold bears who have been very recently converted to the bearish cause because of the 'double top' chart formation that I have alluded to before.
If the market can make it back to the Fibonacci 38% level (within $10-$15 from current), I will want to be on board, looking for a very rapid ascent and a large potential profit.
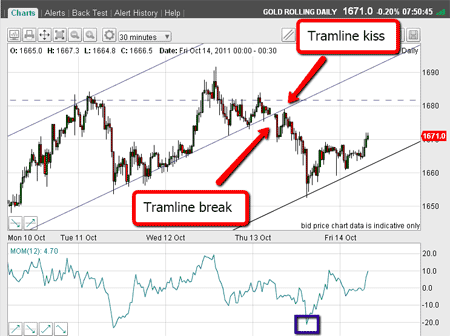
Also on this chart, I have drawn my most recent tramlines here is a close-up:

(Click on the chart for a larger version)
Yesterday, I was following the market as it chugged up along the central tramline. I felt that a break was imminent, as the rally looked very laboured. So I placed a sell order just beneath, which was touched.
After a dip, the market rallied again right back to the underside of the tramline in a classic 'kiss'.
This was another point to offer a great short trade and at low risk, where protective stops could be placed just above the tramline.
The market did decline from the kiss in a 'scalded cat bounce', and the trade was on!
With my upper tramline pair confirmed, I could now draw my third (lower) tramline. That was to be my initial target.
Lo and behold, the market declined to barely touch this line and then staged a bounce from an oversold momentum reading (marked with purple box).
That was a great place to take short-term profits.
A new set of tramlines and a new target
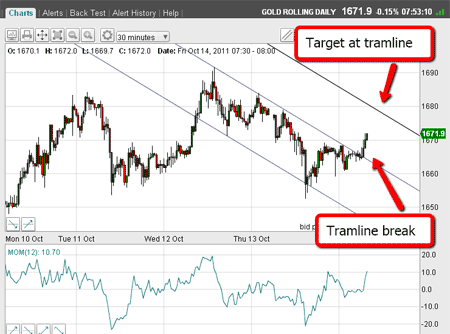
Later yesterday, the market backed and filled, and I was now able to draw a totally different set of tramlines.
Here is a close-up:

(Click on the chart for a larger version)
The upper tramline is a good one and has several excellent touch-points. The lower one is a lot more speculative, as it has only one touch-point. I may need to alter the position of that one as trading develops.
However, a long trade was indicated when the market broke above the upper tramline this morning, making my third tramline my target. But this target is still shy of the critical 38% level.
My long entry is at the $1,667 level and I have a stop at $1,662. If the market can reach my tramline target, I intend to take profits. I do not want to stay around a long trade in gold too long, despite the potential I have already mentioned.
I will observe the action if the market does make it back up to the 38% level at around $1,680 / $1,690. Otherwise, I shall be alert to a resumption of the main downtrend, where I believe most of the profitable trades will continue to be made.
If you're a new reader, or need a reminder about some of the methods I refer to in my trades, then do have a look at my introductory videos:
The essentials of tramline trading
An introduction to Elliott wave theory
Don't miss my next trading insight. To receive all my spread betting blog posts by email, as soon as I've written them, just sign up here .
Get the latest financial news, insights and expert analysis from our award-winning MoneyWeek team, to help you understand what really matters when it comes to your finances.
John is is a British-born lapsed PhD physicist, who previously worked for Nasa on the Mars exploration team. He is a former commodity trading advisor with the US Commodities Futures Trading Commission, and worked in a boutique futures house in California in the 1980s.
He was a partner in one of the first futures newsletter advisory services, based in Washington DC, specialising in pork bellies and currencies. John is primarily a chart-reading trader, having cut his trading teeth in the days before PCs.
As well as his work in the financial world, he has launched, run and sold several 'real' businesses producing 'real' products.
-
 MoneyWeek Talks: The funds to choose in 2026
Podcast Fidelity's Tom Stevenson reveals his top three funds for 2026 for your ISA or self-invested personal pension
-
 Three companies with deep economic moats to buy now
Opinion An economic moat can underpin a company's future returns. Here, Imran Sattar, portfolio manager at Edinburgh Investment Trust, selects three stocks to buy now