What will gold do next?
The dramatic plunge in the gold price has whipped up the market into a frenzy. Here, John C Burford takes a long, cold look at the charts - and draws some surprising conclusions.
Get the latest financial news, insights and expert analysis from our award-winning MoneyWeek team, to help you understand what really matters when it comes to your finances.
You are now subscribed
Your newsletter sign-up was successful
Want to add more newsletters?

Twice daily
MoneyWeek
Get the latest financial news, insights and expert analysis from our award-winning MoneyWeek team, to help you understand what really matters when it comes to your finances.

Four times a week
Look After My Bills
Sign up to our free money-saving newsletter, filled with the latest news and expert advice to help you find the best tips and deals for managing your bills. Start saving today!
There are significant developments in all three of my major markets this week.
But with all eyes on the stunning collapse in gold, I will concentrate my attention here and my conclusions may surprise you!
When I last covered gold on 10 April, I posted the daily chart showing the widely-watched support at the $1,525 area:
MoneyWeek
Subscribe to MoneyWeek today and get your first six magazine issues absolutely FREE

Sign up to Money Morning
Don't miss the latest investment and personal finances news, market analysis, plus money-saving tips with our free twice-daily newsletter
Don't miss the latest investment and personal finances news, market analysis, plus money-saving tips with our free twice-daily newsletter
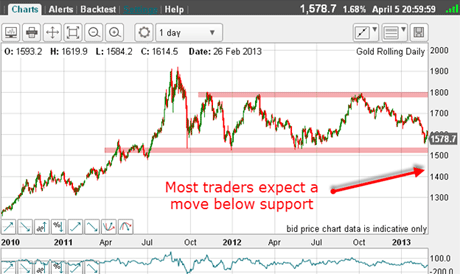
(Click on the chart for a larger version)
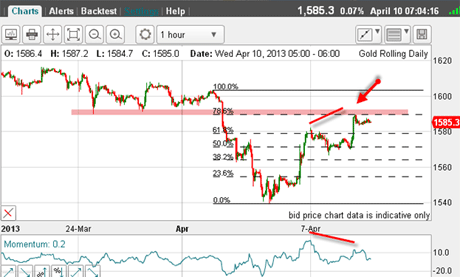
Then, I suggested that the market may have more to go on the upside after rallying from the $1,540 level:
(Click on the chart for a larger version)
But as I mentioned, this rally had a classic A-B-C form with a clear negative-momentum divergence (red bars) between the A and C wave tops. It was also trying to eat into the solid overhead resistance (pink bar).
I suggested that many traders would be shorting on this signal. I wrote: "Because of this, here would be an excellent place for short-term traders to take a major profit of around 400 pips... and for other traders without a position to look to short!"
And how right they were!
What a collapse! I'm sure you have all read the gory details in the media.
As you know, I have been a gold bear since the 2011 high at $1,920.
Back then, I projected a very long-term target under $500. That was mainly due to the coming deflationary scenario I envisage.
But that is of no real interest for swing trading, which is the style I cover in my posts.
Please don't confuse the long-term picture with the short-term. As swing traders, all we ask is for a decent swing in either direction!And sometimes, that swing will go against the major trend.
Let's take a cold hard look at the market
Gold is the most emotional of markets, and because it attracts many traders who hold passionate views, the swings are enormous and ideal for swing trading.
Naturally, if you were one of the many who were on the long side, you will be nursing losses. But if you had been employing my 3% rule, you would have been kept out of major trouble. And that is the number one task for all traders.
If you can avoid a catastrophic loss, you have a fighting chance to win as a trader. But all it takes is one huge error in money management and you are out of the game. This must not happen to you.
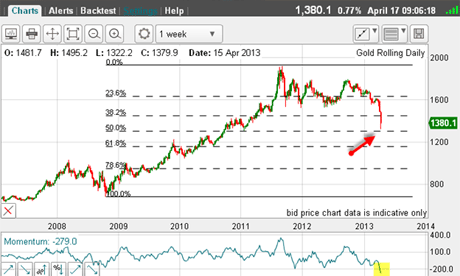
Here is the weekly chart over the past six years for the big picture:
(Click on the chart for a larger version)
I have drawn in the Fibonacci levels using the last major low in 2008 as alow pivot point and right away, I can see the plunge has made an almost direct hit on the 50% Fibonacci level. This is interesting!
Also, momentum has fallen to a level not seen forat least six years. Also interesting.
Are you starting to see where I am going?
Now let's see how the various players are lined up from the commitmentof traders(COT) data.Here is the latest set as of 9 April:
| OPEN INTEREST: 416,513 | ||||||||
| COMMITMENTS | ||||||||
| 203,812 | 84,453 | 23,873 | 135,855 | 279,657 | 363,540 | 387,983 | 52,973 | 28,530 |
| CHANGES FROM 04/02/13 (CHANGE IN OPEN INTEREST: -663) | ||||||||
| 1,178 | 2,025 | -1,211 | -1,350 | -70 | -1,383 | 744 | 720 | -1,407 |
| PERCENT OF OPEN INTEREST FOR EACH CATEGORY OF TRADERS | ||||||||
| 48.9 | 20.3 | 5.7 | 32.6 | 67.1 | 87.3 | 93.2 | 12.7 | 6.8 |
| NUMBER OF TRADERS IN EACH CATEGORY (TOTAL TRADERS: 354) | ||||||||
| 183 | 87 | 79 | 59 | 49 | 274 | 189 | Row 8 - Cell 7 | Row 8 - Cell 8 |
I thinkthe next report as of yesterday (to be released later this week) will definitely show a few changes!
Has gold made its major low?
The important point is that the media are whipping up a very negative mood, and there are many doom-laden forecasts being bandied about.This is usually the time when markets perform their time-honoured task of surprising the majority.
After all, gold did it to the bulls,will it now do it to the bears?There must be many Johnny-come-latelies that jumped on the bear wagon in the past few days dreaming of much lower prices.
This is entirely predictable after most in the media had been extolling gold's virtues to the skies until less than week ago, that is.
One other point for those who trade off the fundamentals', using such data as mine production, central bank sales, coin demand, Indian jewellery demand and so forth. I imagine not much has changed in these areas in the past week, yet the market plunged by $250. How to explain that using fundamentals?
Putting all of this together, I am trying to make a case that gold has made, or is very close to making a major low.
What evidence can I find for this view?
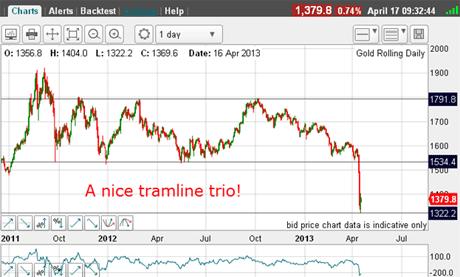
Let's zoom in on the daily chart:
(Click on the chart for a larger version)
Here, I discover a terrific tramline trio, where the market sank right to the lower line. That is very pretty, don't you think?
And this morning, the market is staging a relief bounce as I write.
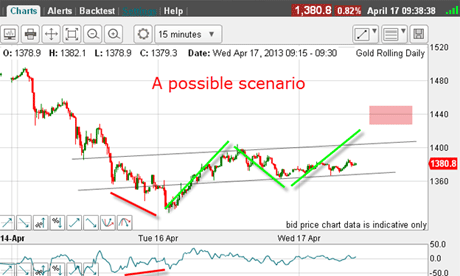
OK, let's see what the 15-minute chart can tell me:
(Click on the chart for a larger version)
I have drawn in one set out of the many possibles. And I have a nice positive-momentum divergence at the $1,330 low which signals a probable reversal.
I have a wave up and then a wave down and we are currently in another wave up. This has the hallmarks of an A-B-C and a likely target for the C top is in the $1,440 area and possibly higher.
The key to a long trade is, of course, avoiding another sharp leg down! That is where stop losses come into play, of course.
And here is another thought: A much more outrageous possibility is for the market to rally back to my centre tramline in the $1,530 area.And with the market deeply oversold and psychologically bombed-out this is not out of the question.
But there is no doubt that if you can get your timing right, the gold market offers riches galore.
If you're a new reader, or need a reminder about some of the methods I refer to in my trades, then do have a look at my introductory videos:
The essentials of tramline trading Advanced tramline trading An introduction to Elliott wave theory Advanced trading with Elliott waves Trading with Fibonacci levels Trading with 'momentum' Putting it all together
Don't miss my next trading insight. To receive all my spread betting blog posts by email, as soon as I've written them, just sign up here . If you have any queries regarding MoneyWeek Trader, please contact us here.
Get the latest financial news, insights and expert analysis from our award-winning MoneyWeek team, to help you understand what really matters when it comes to your finances.
John is is a British-born lapsed PhD physicist, who previously worked for Nasa on the Mars exploration team. He is a former commodity trading advisor with the US Commodities Futures Trading Commission, and worked in a boutique futures house in California in the 1980s.
He was a partner in one of the first futures newsletter advisory services, based in Washington DC, specialising in pork bellies and currencies. John is primarily a chart-reading trader, having cut his trading teeth in the days before PCs.
As well as his work in the financial world, he has launched, run and sold several 'real' businesses producing 'real' products.
-
 Can mining stocks deliver golden gains?
With gold and silver prices having outperformed the stock markets last year, mining stocks can be an effective, if volatile, means of gaining exposure
-
 8 ways the ‘sandwich generation’ can protect wealth
People squeezed between caring for ageing parents and adult children or younger grandchildren – known as the ‘sandwich generation’ – are at risk of neglecting their own financial planning. Here’s how to protect yourself and your loved ones’ wealth.