There’s life in gold yet
The headlines are screaming at investors to get out of gold. But as John C Burford explains, that means chart-following traders should expect a rally.
Get the latest financial news, insights and expert analysis from our award-winning MoneyWeek team, to help you understand what really matters when it comes to your finances.
You are now subscribed
Your newsletter sign-up was successful
Want to add more newsletters?

Twice daily
MoneyWeek
Get the latest financial news, insights and expert analysis from our award-winning MoneyWeek team, to help you understand what really matters when it comes to your finances.

Four times a week
Look After My Bills
Sign up to our free money-saving newsletter, filled with the latest news and expert advice to help you find the best tips and deals for managing your bills. Start saving today!
I will continue with gold today, since it is offering a textbook example in real time of how an observant trader can spot an extreme sentiment in a market. That gives him confidence to make a low-risk trade against the majority opinion.
On Monday, I highlighted several important clues that bearish sentiment was perhaps reaching an extreme. And I gave my methodology for pinpointing my long trade, using tramlines and a bullish momentum divergence.
And yesterday, I read another article that outright screamed "Sell your gold!" Here's another: "Investors are selling gold ETFs at a record pace. Approximately 106 tonnes of bullion was dumped in February", according to CNNMoney. "That's the biggest monthly sell-off ever. That's where your selling pressure is coming from - whether you like it or not.
MoneyWeek
Subscribe to MoneyWeek today and get your first six magazine issues absolutely FREE

Sign up to Money Morning
Don't miss the latest investment and personal finances news, market analysis, plus money-saving tips with our free twice-daily newsletter
Don't miss the latest investment and personal finances news, market analysis, plus money-saving tips with our free twice-daily newsletter
"The gold cycle is turning. Avoid the ETFs and miners. If you own them, get out now. These will be the most vulnerable investments as the drop approaches."
That is kind of bearish, isn't it? It's rare to see such unequivocal selling advice in an article from this source. This is a major canary in the coal (gold?) mine.
Buy advice is common but you're not often told to sell.
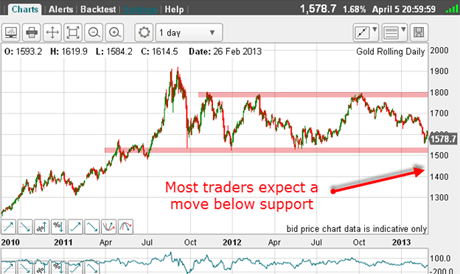
The drop referred to is, of course, the notorious and widely-anticipated drop beneath the $1,500 - $1,525 zone that I covered on Monday, when I wrote that, because it was received wisdom that it would drop under $1,525, it was unlikely to occur at least not before a major short squeeze.

(Click on the chart for a larger version)
That short squeeze is now in evidence with the market up around $50 off the lows in just a few days!
Trader tip: I cannot stress too strongly that to judge a market's potential, you must pay attention to current sentiment. When you believe it is reaching an extreme, that is when you look to trade against prevailing opinion. Monitor the well-known sentiment indicators, the Comittments of Traders(COT) data (with changes on the week), and of course, scan the press (see above).
Also, never get married to a market view. Try to be an outside observer, not an emotional participant. Your job is to monitor what the other players are doing and thinking. The market cares not a whit for your own views, remember!
If the rally has legs, I expect to start seeing more bullish articles doubting the validity of the idea that the $1,525 support zone will be breached. That you can take to the bank.
In fact, we will likely see articles that do not even mention this support zone it will be a non-event. And when that happens, stand by for another attack on it.
But by then, the nimble trader has taken profits on the short squeeze and perhaps even positioned short again in readiness.
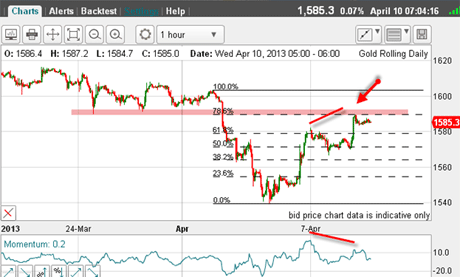
On Monday, I showed the rally to the Fibonacci 62% level. Since then, it has extended the move and last night, has hit the 76% level:

(Click on the chart for a larger version)
So far, so good.
But a note of caution the rally has a clear A-B-C form with a large potential negative-momentum divergence. At the current level, it is also hitting against the chart resistance zone (pink zone).
Because of this, here would be an excellent place for short-term traders to take a major profit of around 400 pips...
and for other traders without a position to look to short!
So how does the long-term picture look?
As a starting point, keep an eye on sentiment and monitor the COT data updated every Tuesday. And just a cursory reading of article titles in the financial media will often give a sense of where the market is positioned.
This applies to the major futures markets, but obtaining sentiment readings of more obscure markets is much more difficult. That is one reason why I normally restrict my trading to the majors.

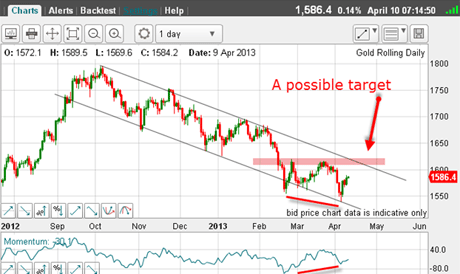
(Click on the chart for a larger version)
Here are my tramlines on the daily chart, showing the very large positive-momentum divergence at last week's $1,540 low.
Because of the extreme negative sentiment still surrounding the market, it is very likely that many traders are shorting into this rally.
And if the market can punch up to the upper tramline, where it meets the overhead resistance in the $1,620 region, the potential is for much higher values.
This morning, my view is that this could be the A wave of a larger A-B-C rally, leading to a move down in the B wave and then a move up towards the upper tramline in the C wave.
The more bullish alternative scenario is that a five-wave rally could materialise and this implies a much greater upside potential perhaps up to the $1,800 area I mentioned on Monday.
But that is pure speculation at this point. We only have one up leg to work on - so far.
If you're a new reader, or need a reminder about some of the methods I refer to in my trades, then do have a look at my introductory videos:
The essentials of tramline trading
An introduction to Elliott wave theory
Advanced trading with Elliott waves
Don't miss my next trading insight. To receive all my spread betting blog posts by email, as soon as I've written them, just sign up here . If you have any queries regarding MoneyWeek Trader, please contact us here.
Get the latest financial news, insights and expert analysis from our award-winning MoneyWeek team, to help you understand what really matters when it comes to your finances.
John is is a British-born lapsed PhD physicist, who previously worked for Nasa on the Mars exploration team. He is a former commodity trading advisor with the US Commodities Futures Trading Commission, and worked in a boutique futures house in California in the 1980s.
He was a partner in one of the first futures newsletter advisory services, based in Washington DC, specialising in pork bellies and currencies. John is primarily a chart-reading trader, having cut his trading teeth in the days before PCs.
As well as his work in the financial world, he has launched, run and sold several 'real' businesses producing 'real' products.
-
 Last chance to invest in VCTs? Here's what you need to know
Investors have pumped millions more into Venture Capital Trusts (VCTS) so far this tax year, but time is running out to take advantage of tax perks from them.
-
 ISA quiz: How much do you know about the tax wrapper?
Quiz One of the most efficient ways to keep your savings or investments free from tax is by putting them in an Individual Savings Account (ISA). How much do you know about ISAs?