Watch out for the snap-back stock rally
The mood is very bearish in the markets, says John C Burford. Traders need to watch out for a snap-back rally that can occur at any time.
Get the latest financial news, insights and expert analysis from our award-winning MoneyWeek team, to help you understand what really matters when it comes to your finances.
You are now subscribed
Your newsletter sign-up was successful
Want to add more newsletters?

Twice daily
MoneyWeek
Get the latest financial news, insights and expert analysis from our award-winning MoneyWeek team, to help you understand what really matters when it comes to your finances.

Four times a week
Look After My Bills
Sign up to our free money-saving newsletter, filled with the latest news and expert advice to help you find the best tips and deals for managing your bills. Start saving today!
That was one historic week with stocks in virtual freefall. For the FTSE it was the heaviest opening loss since 2000. For the Dow, the first four days loss was the biggest on record. That is some record to have achieved.
But don't say no one was warning this could happen. After the 2007/2008 crash, many pundits claimed no one saw that coming, too. Nonsense. That was uttered by those who failed to see the warning signs line up and were steadfastly bullish with their careers depending on it.
And predictably, the pundits were out in force over the weekend advising investors to wait out this 'dip'. Here is a typical quote: "There is nothing we can do except step back, hunker down and wait for the carnage to play out".
MoneyWeek
Subscribe to MoneyWeek today and get your first six magazine issues absolutely FREE

Sign up to Money Morning
Don't miss the latest investment and personal finances news, market analysis, plus money-saving tips with our free twice-daily newsletter
Don't miss the latest investment and personal finances news, market analysis, plus money-saving tips with our free twice-daily newsletter
Translation: "We missed getting out at the top so to save face, let's pull out our stock advice and maybe a miracle will save us."At least this person has recognised carnage when he sees it. What those in the industry will never do is advise selling shares and getting out their careers depend on keeping investors fully invested. The only time they might throw in the towel is right at a major bottom, which is many months away.
But I take such quotes as a measure of sentiment. As I pointed out last time, the mood is now very bearish and a snap-back rally can occur at any time which can test the nerve of shorts.
I have been bearish the stockmarket for some time and was waiting for just such action. But I needed the chart to tell me the tide had turned. If you get your timing wrong, it is all too easy to lose money despite being correct in your outlook.
For example, here was the S&P chart I posted on my first postof 2016 on 4 January as the 'carnage' was getting into its stride:
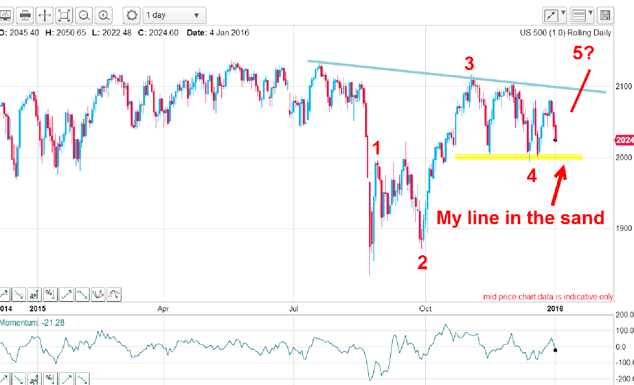
I wrote: "And if we do have a truncated fifth, the outlook is very bearishindeed."My line in the sand was the wave 4 low at the 2,000 level, and on Wednesday, the market blew straight past that to close on Friday at the 1,920 area:
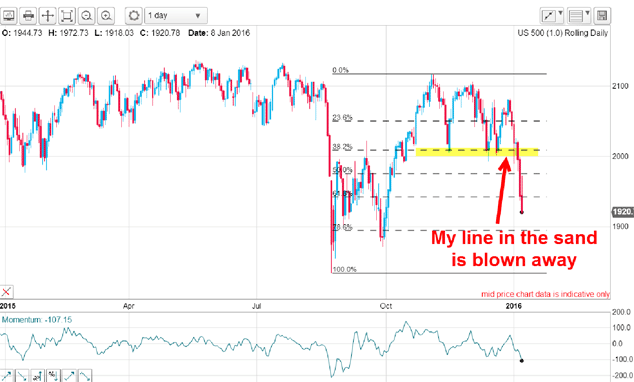
Whenever a major line in the sand is broken, that is a tradable event.
But today, I want to follow up on two stunning chart patterns I alerted you to in my 18 December post, because they illustrate that a simple approach to chart reading can set up some terrific trades.
The trend reversal in USD/JPY
First, there was the complete five up to the recent high from the 2,100 lows shown in the daily chart I posted in December:
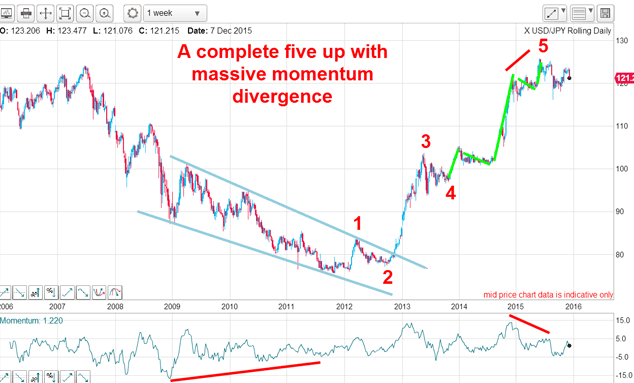
That huge bull market was flagged by the upside break of the beautiful wedge and lengthy momentum divergence going into the low. And at the wave 5 high, another momentum divergence appeared, hinting that the buying power was waning and to expect a turn.
Looking at recent action, I identified a five-wave continuation pattern:
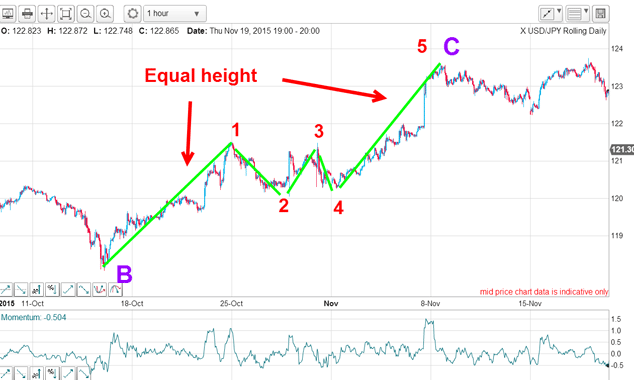
I noted that when these patterns appear, they usually lie about half-way along the trend. That allowed me to set an upside measured price target in the 124 area, which is where the market was stalling.
Finally, I noted the lovely tramlines on the hourly chart:
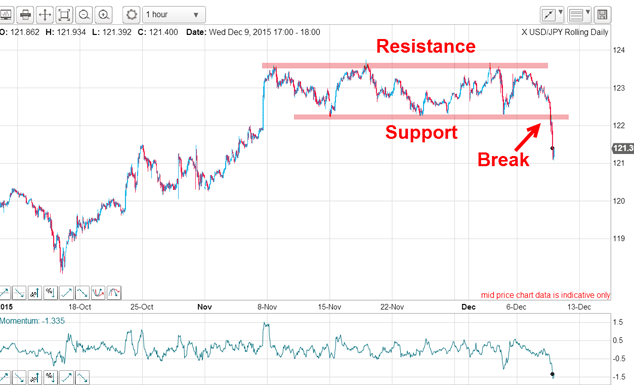
The market was clearly struggling to continue its advance and a break of support at the lower tramline was the final clue that the trend had likely turned down.
Here is the updated daily chart:
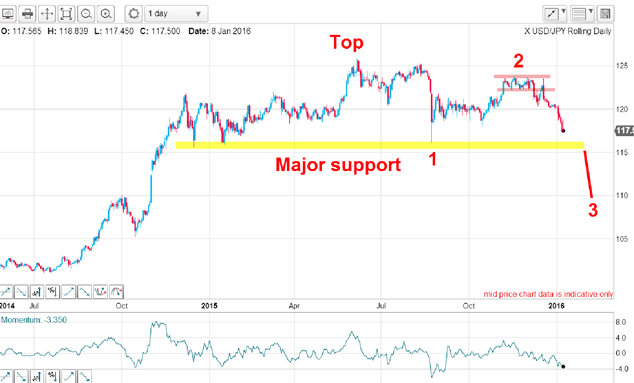
A short sale at the tramline break around the 122 area was indicated and the market is trading 500 pips to the good.
A break of support at my line in the sand would confirm the wave 3 label.
The beautiful Barclays wedge
I believe there is enough profit potential in the large caps in the FTSE 100 (and US markets) to keep me busy.
But I just couldn't resist tracking Barclays which is one of the largest global banks. It sported a compelling chart pattern and it was the multi-year wedge that caught my eye. This is the chart I showed in December:
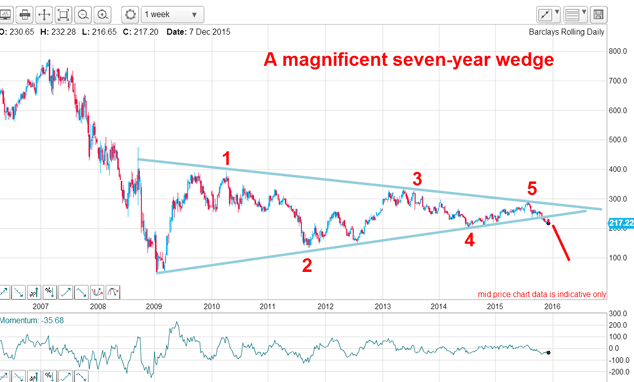
In fact, I began to take a serious interest late last year when the market was putting in wave 5 at the 280 area. I recognised that was an ideal place to enter a short trade, because I could enter a close protective stop above the upper wedge line.
Here is the chart updated in close up:
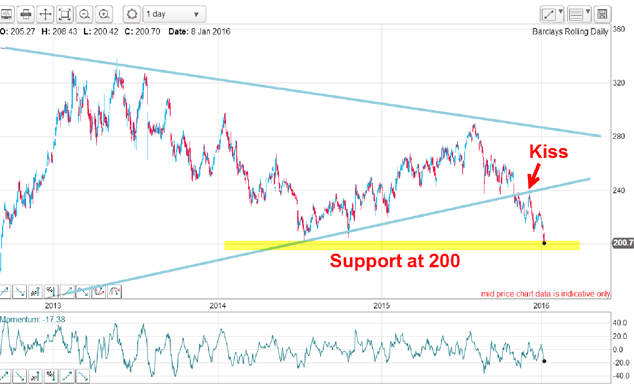
The lower wedge line was broken and that indicated a resumption of the down trend with my first target at the 200 support level. The shares closed on Friday at the 200 print a full 16% down off the kiss.
So look out for wedges on your charts they can be gold dust.
Get the latest financial news, insights and expert analysis from our award-winning MoneyWeek team, to help you understand what really matters when it comes to your finances.
John is is a British-born lapsed PhD physicist, who previously worked for Nasa on the Mars exploration team. He is a former commodity trading advisor with the US Commodities Futures Trading Commission, and worked in a boutique futures house in California in the 1980s.
He was a partner in one of the first futures newsletter advisory services, based in Washington DC, specialising in pork bellies and currencies. John is primarily a chart-reading trader, having cut his trading teeth in the days before PCs.
As well as his work in the financial world, he has launched, run and sold several 'real' businesses producing 'real' products.
-
 Average UK house price reaches £300,000 for first time, Halifax says
While the average house price has topped £300k, regional disparities still remain, Halifax finds.
-
 Barings Emerging Europe trust bounces back from Russia woes
Barings Emerging Europe trust has added the Middle East and Africa to its mandate, delivering a strong recovery, says Max King