Two perfect patterns are forming in the charts
Two textbook patterns are forming in the charts, says John C Burford. The analysis speaks for itself.
Get the latest financial news, insights and expert analysis from our award-winning MoneyWeek team, to help you understand what really matters when it comes to your finances.
You are now subscribed
Your newsletter sign-up was successful
Want to add more newsletters?

Twice daily
MoneyWeek
Get the latest financial news, insights and expert analysis from our award-winning MoneyWeek team, to help you understand what really matters when it comes to your finances.

Four times a week
Look After My Bills
Sign up to our free money-saving newsletter, filled with the latest news and expert advice to help you find the best tips and deals for managing your bills. Start saving today!
I'll keep my patter short and sweet this week. There are two textbook patterns forming this week, one in the USD/JPY cross, and one for Barclays. I'll let my analysis speak for itself.
The five-wave continuation pattern in USD/JPY
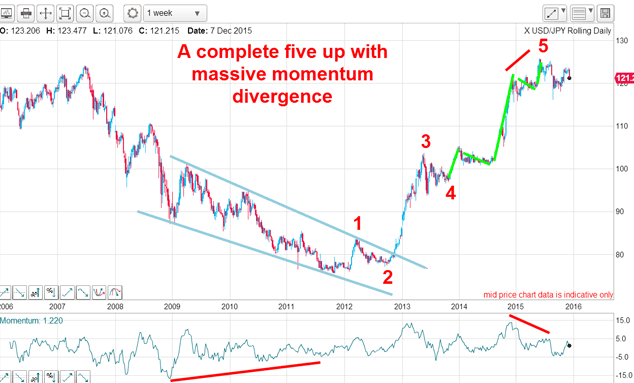
The bull market really got going in 2013 from the 80 area. From 2009 2012, the market traced out a wedge and at the low, there was a very large momentum divergence. This heralded a probable very sharp rally phase (which materialised!).
MoneyWeek
Subscribe to MoneyWeek today and get your first six magazine issues absolutely FREE

Sign up to Money Morning
Don't miss the latest investment and personal finances news, market analysis, plus money-saving tips with our free twice-daily newsletter
Don't miss the latest investment and personal finances news, market analysis, plus money-saving tips with our free twice-daily newsletter
And then, the bull run is in a complete impulsive five up with another momentum divergence at the 125 wave 5 high. Note the extended fifth wave (a typical feature of currency charts, for some reason), which itself contains a textbook five waves up (marked in green).
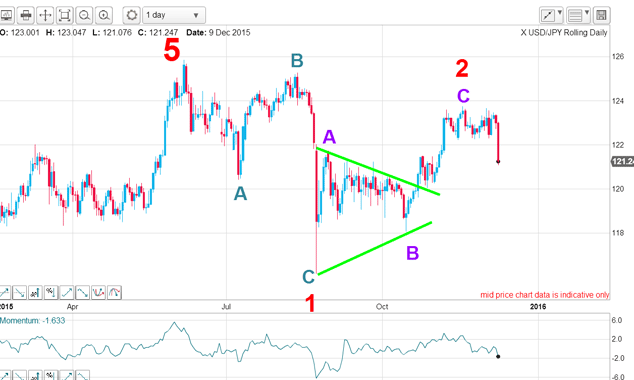
From the June wave 5 high, the market descended to the August spike low in an A-B-C. Then it rallied in another A-B-C where wave B is a wedge.
It is wave C I wish to focus on here:
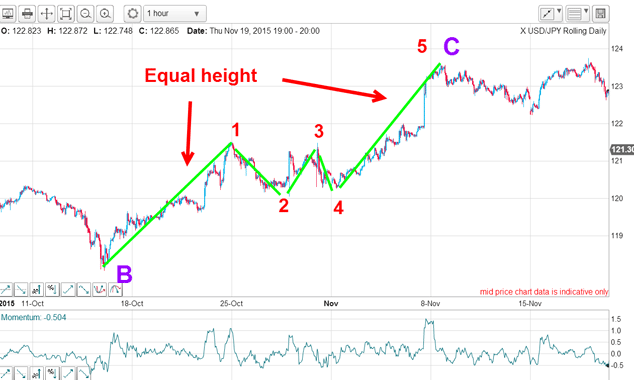
The move off the B wave low is a rally to wave 1, then a dip in wave 2. It then rallies in wave 3, then another dip in wave 4 and then a final thrust in wave 5.
It is when the rally off the wave 4 low rises above the waves 1 and 3 tops that I can call it a five-wave continuation pattern.
The basic rule is that the target is set by the equality of the price rise from the bottom of the C wave to the wave 1 high to the rise from the wave 4 low to the pre-determined target.
In other words, this little five wave 'zig-zag' lies about half way along the C wave. With this knowledge, there is a low risk long trade from a point just above the waves 1 and 3 highs (around the 121.50 level) with the exit (from the projected target) around the 123.20 level for a quick 170 pip gain.
In addition, there is another fabulous pattern on this chart:
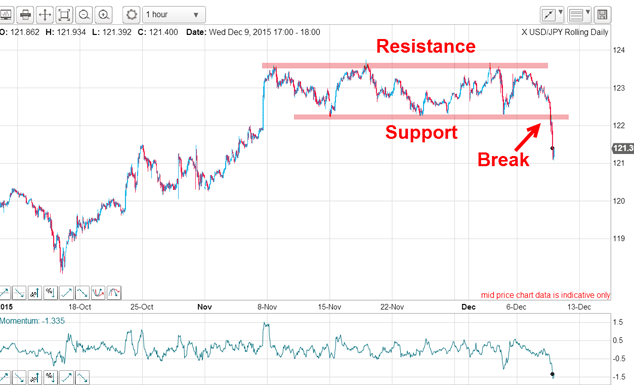
During November, the market traded in the band between the upper resistance level and the lower support level. Something had to give it was either a sharp rally or a break. Remember, this congestion zone lies very close to the all-time high around 125.
Now the market has tipped its hand and is declining. The congestion zone between the 122 and 124 area is what I call a head of supply. Inside it, there are many disappointed longs who have bought into the strong dollar story as well as the belief that Abenomics (printing yen by QE) is the obvious path to a weaker yen. So much for that theory!
The supply is the mass of traders who will grab an opportunity to exit (sell) their positions on any rally to limit losses.
Just one more wedge and what a beauty!
And what a textbook example it now is! It now has five waves complete at the 290 high in August which is my final wave 5. And right on cue, the market broke below the lower wedge line a few weeks ago and is heading down:
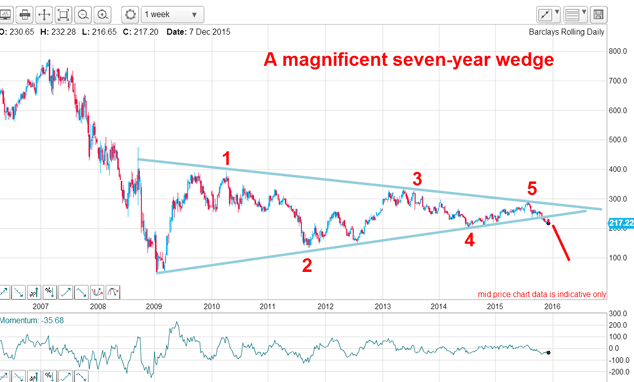
This example is a continuation wedge and it has been built up over an incredible seven years. That is one gigantic coiled spring!
This pattern also offers a price target and the bulls will not like this one bit.
The minimum target is the start of the wedge in this case, the 47 pence 2009 low.
Get the latest financial news, insights and expert analysis from our award-winning MoneyWeek team, to help you understand what really matters when it comes to your finances.
John is is a British-born lapsed PhD physicist, who previously worked for Nasa on the Mars exploration team. He is a former commodity trading advisor with the US Commodities Futures Trading Commission, and worked in a boutique futures house in California in the 1980s.
He was a partner in one of the first futures newsletter advisory services, based in Washington DC, specialising in pork bellies and currencies. John is primarily a chart-reading trader, having cut his trading teeth in the days before PCs.
As well as his work in the financial world, he has launched, run and sold several 'real' businesses producing 'real' products.
-
 Inheritance tax investigations net HMRC an extra £246m from bereaved families
HMRC embarked on almost 4,000 probes into unpaid inheritance tax in the year to last April, new figures show, in an increasingly tough crackdown on families it thinks have tried to evade their full bill
-
 Average UK house price reaches £300,000 for first time, Halifax says
While the average house price has topped £300k, regional disparities still remain, Halifax finds.