Volatile commodity prices are great news for traders
Turbulent commodity prices have sent investors running, says John C Burford. It's time for chart-following swing traders to come out to play.
Get the latest financial news, insights and expert analysis from our award-winning MoneyWeek team, to help you understand what really matters when it comes to your finances.
You are now subscribed
Your newsletter sign-up was successful
Want to add more newsletters?

Twice daily
MoneyWeek
Get the latest financial news, insights and expert analysis from our award-winning MoneyWeek team, to help you understand what really matters when it comes to your finances.

Four times a week
Look After My Bills
Sign up to our free money-saving newsletter, filled with the latest news and expert advice to help you find the best tips and deals for managing your bills. Start saving today!
On Wednesday, I explained how I found excellent and very profitable swing trades in the GBP/USD market using simple Elliott wave and Fibonacci concepts. The market gave textbook turns at highly accurate and forecastable price points.
Today, I want to cover the FTSE 100 index, which is a market that I follow avidly, though I do not trade it quite as often as the Dow. Nevertheless, the FTSE has offered and still offers some excellent swing trades.
About 20% of the market cap is made up of commodity companies, which means the index is somewhat aligned with commodity prices. Of course, those prices have taken a hammering in recent months. But a relief rally in copper, aluminium and other metals as well as a staggering rally in crude oil has lent support to the FTSE in recent days.
MoneyWeek
Subscribe to MoneyWeek today and get your first six magazine issues absolutely FREE

Sign up to Money Morning
Don't miss the latest investment and personal finances news, market analysis, plus money-saving tips with our free twice-daily newsletter
Don't miss the latest investment and personal finances news, market analysis, plus money-saving tips with our free twice-daily newsletter
Knowing a market's history is crucial for traders
The rally off the 2009 low has flowed within a lovely wedge (blue lines) that has multiple pretty accurate touch points. And the entire bull market is in a clear A-B-C form, which is counter-trend meaning that when the main trend resumes, it will be down.
The final thrust into new highs occurred on a momentum divergence, indicating the rally was running out of steam from 2013. I was therefore prepared for a major turn down at some point.
And when the market broke below the lower blue line, that was my confirmation that the bear market was in force and my first major target is at the lower tramline (tan line) in the 5,400 region. I drew this line equidistant from the upper blue line.
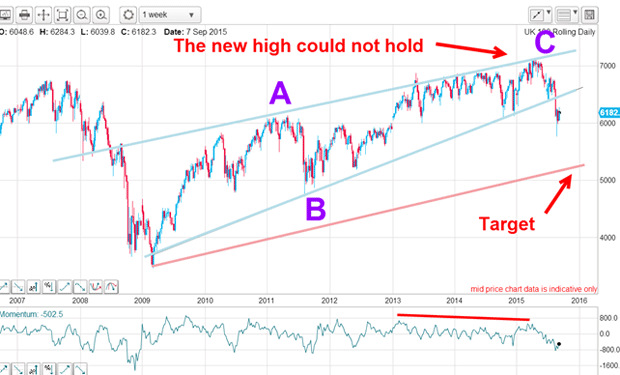
This is a very important rule concerning wedges: when a wedge is broken, it is normal for the market to move in the opposite direction the same distance as it moved up or down from the start of the wedge. That places my other target near the 2009 lows in the 3,500 region. Of course, that may not be the end of the story and lower targets are possible, depending on the chart patterns that are to be traced out.
So, that is my long-term roadmap.
What's next for the FTSE 100?
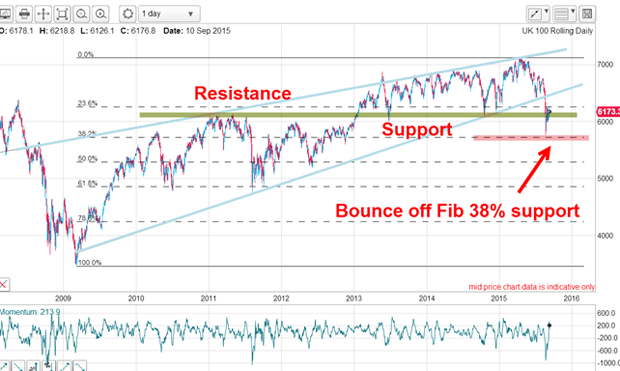
That zone is therefore a very important area for the market. Since 2011, it has considered that zone critical, and I shall do likewise.
However, the August plunge broke that support and the market rapidly moved down to the Fibonacci 38% support level. That support was sufficient to reverse the decline and currently, the market is back up testing the green zone resistance.
Let's take a closer look. Below is the daily chart from 2014. From last year, the market has traced out another wedge (this market is full of them). And when the market broke below the lower line, that was the ideal signal to short this market.
But note the market reached my wedge target at the start of the wedge at the 6,200 region and demonstrated the validity of the wedge target rule very quickly. Refer back to my main forecast above, where I call for a decline to the 3,500 area at the start of the large scale wedge.
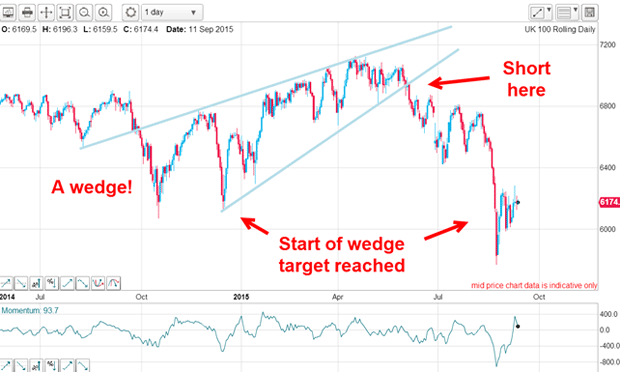
Of course, that target was an opportunity to take profits if so desired and that would be a gain of around 700 points, or a profit of £7,000 on just a £1 spread bet.
So now, we have a new bear trend operating and in the last few days, the market has rallied in a relief swing right into the green resistance zone (see second chart).
My short position was a trader's dream
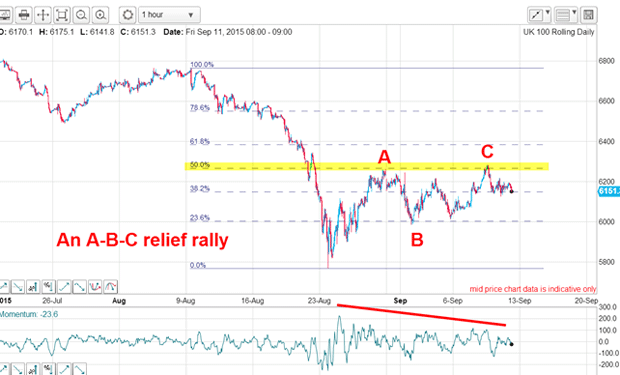
Confirmation of my analysis will come if/when the market breaks the B wave low at 6,000. Until then, the relief rally could develop into something a little more complex. But the short trade at the C wave high was the textbook play and it could have been placed at low risk by entering your protective stop just above entry.
So just by following simple tramline trading concepts, it has been possible to identify some great low-risk trades, and with the bonus of being able to forecast price targets well in advance.
What more could a trader want?
Get the latest financial news, insights and expert analysis from our award-winning MoneyWeek team, to help you understand what really matters when it comes to your finances.
John is is a British-born lapsed PhD physicist, who previously worked for Nasa on the Mars exploration team. He is a former commodity trading advisor with the US Commodities Futures Trading Commission, and worked in a boutique futures house in California in the 1980s.
He was a partner in one of the first futures newsletter advisory services, based in Washington DC, specialising in pork bellies and currencies. John is primarily a chart-reading trader, having cut his trading teeth in the days before PCs.
As well as his work in the financial world, he has launched, run and sold several 'real' businesses producing 'real' products.
-
 MoneyWeek news quiz: Can you get smart meter compensation?
Smart meter compensation rules, Premium Bonds winners, and the Bank of England’s latest base rate decision all made the news this week. How closely were you following it?
-
 Adventures in Saudi Arabia
Travel The kingdom of Saudi Arabia in the Middle East is rich in undiscovered natural beauty. Get there before everybody else does, says Merryn Somerset Webb