On Friday, I explained how I use my 'headline indicator' to help forecast a rally in crude oil. This is a very useful tool in any trader's toolkit, so today on this (UK-only) Bank Holiday, I will delve a bit further into this much under-used indicator.
Most pundits and junior and senior mediareporters alike labour under the misconception that it is the news that makes the markets. Follow the news and you will understand how the markets work. It sounds so reasonable, doesn't it? A plausible story can be written around it and we all love stories.
Of course, when you read an article on finance it is usually about a market event that has already happened. For instance, Friday morning's headlines after Thursday's surge in crude tries to explain why it 'suddenly' jumped by $4.
Try 6 free issues of MoneyWeek today
Get unparalleled financial insight, analysis and expert opinion you can profit from.

Sign up to Money Morning
Don't miss the latest investment and personal finances news, market analysis, plus money-saving tips with our free twice-daily newsletter
Don't miss the latest investment and personal finances news, market analysis, plus money-saving tips with our free twice-daily newsletter
Bloomberg's headline read: "Oil surges most in six years on faster US economic growth", referencing that day's GDP report that showed a slight uptick in Q2 data.

But how many times have we seen the markets rally hard on poor data? If the market had fallen on the news, the headline would doubtless have read: "Oil collapses despite faster US economic growth".Reporters cannot lose! But traders and investors can, of course.
Traders have to anticipate market moves and tomorrow's headlines a long time before they are written, and the headline indicator is one more aid to help pinpoint turns.
Time after time in these postsI have shown that cause and effect is so often reversed the news follows the markets.
Also, the vast majority of people when making a forecast, simply extrapolate what has just occurred. If the market has been falling for some time, a growing majority will come to accept that as the status quo and general agreement is reached that the market will keep falling.
And when just about everybody is on board, that is the time of maximum confidence in lower prices and lurid headlines start appearing calling for even lower prices. That is when a 'surprise' rally occurs. And that is often just shy of the headline target.
Remember in 2011 when gold was on its way to $2,000? It hit $1,920 and then started a big bear trend that continues to this day. Also, the euro was supposed to hit parity with the dollar last March it hit 1.06 and then rallied.
Round number targets are rarely hit. So is petrol at £1 a litre just pie in the sky?
Yes, markets can and do trade in established trends, but the trend starts from a point where almost everyone is wrong and that is when my headline indicator is the most useful.
Markets are fractal that is they trade in waves of many degrees of trend. The waves are produced by changes in sentiment.
Have you ever read a mediaarticle headline that says: "Oil surges most in six years on termination of the fifth Elliott wave"?I thought not. In fact, you could only read such a headline here and in a few other publications.
The other notable event last week was Black Monday where I pointed out that Tuesday morning's headlines were so apocalyptic that an upward reversal had to occur and that is what we got.
My wave analysis of the Dow (below) shows exactly why that reversal occurred. Black Monday's wipe-out is my wave 3. The wave 4 rally since then has been in a typical A-B-C three up. And my C wave sports a lovely small-scale five up (green lines) with a large negative-momentum divergence:
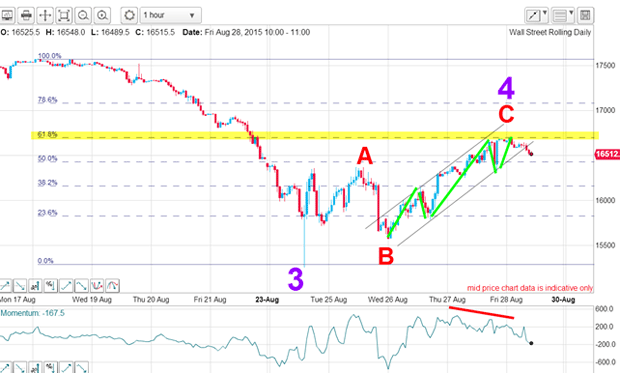
Also, the C wave has hit resistance at the Fibonacci 62% level making the odds high that wave 4 has reached its peak.
The only thing that could spoil that is for the market to rally above the Fibonacci 62% level and perhaps go on to the 78% area. This market has been plagued by many very deep upward retracements of 78% or even more before peeling away again, so I would not rule it out entirely.
So, keep scanning the headlines (you don't have to read the articles!) and you should get a better handle on the markets than most pundits.