The trend for the gold price is still down
Gold's recent rally relief didn't last long. And while there may be some more upside in the short term, the charts indicate further falls ahead, says John C Burford.
Get the latest financial news, insights and expert analysis from our award-winning MoneyWeek team, to help you understand what really matters when it comes to your finances.
You are now subscribed
Your newsletter sign-up was successful
Want to add more newsletters?

Twice daily
MoneyWeek
Get the latest financial news, insights and expert analysis from our award-winning MoneyWeek team, to help you understand what really matters when it comes to your finances.

Four times a week
Look After My Bills
Sign up to our free money-saving newsletter, filled with the latest news and expert advice to help you find the best tips and deals for managing your bills. Start saving today!
I last covered gold on 16 September, when I asked: is gold poised for a big rally? Well, I got my big rally. Gold shot up by over $50 in a day.
But the rally did not last for long. The market continued its decline, playing to my script perfectly. This was the chart I showed last time:
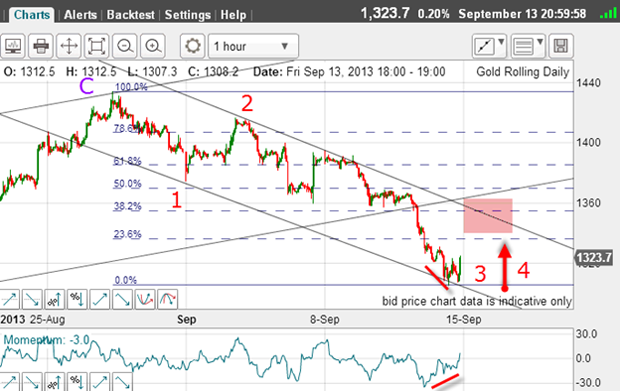
The market declined in three clear waves (with wave 3 long and strong) and traded between my excellent tramlines. There was a striking positive-momentum divergence at the lows, and since the market was testing my lower tramline, those were enough clues to tell me the next likely move was in a strong rally in wave 4.
MoneyWeek
Subscribe to MoneyWeek today and get your first six magazine issues absolutely FREE

Sign up to Money Morning
Don't miss the latest investment and personal finances news, market analysis, plus money-saving tips with our free twice-daily newsletter
Don't miss the latest investment and personal finances news, market analysis, plus money-saving tips with our free twice-daily newsletter
Here's what I wrote: "This is a classic set-up for a large relief rally.
"So, if this count is correct, I expect a wave 4 up and the pink zone around $1,360 appears a likely target. A break of the upper tramline would be very interesting."
Right on cue, the market embarked on the large relief rally, breaking my upper tramline and hitting my $1,360 target:
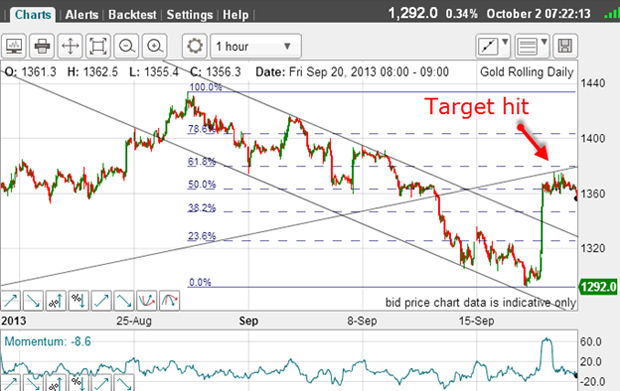
Why did I set my target at the $1,360 area? That was the Fibonacci 50% retrace of the entire move down a common stopping point and there was solid overhead resistance in this region. It was the underside of the lower up-sloping tramline I had drawn from the 28 June low at $1,180!
Why didn't the trend change?
What do I mean by that? The market had become very short (meaning, the speculators had accumulated many more short futures than they did long, as revealed in the commitment of traders (COT) data). And a very sharp short-covering rally usually does not make a lasting move.
The market behaves like a Chinese firecracker once the fuse is lit, the fire moves very rapidly, as wave upon wave of buy stops are hit. And sure enough, when the shorts had completed their painful covering, the market resumed its decline.
That upside move then completed my wave 4 and because my upper tramline had been broken, I had to abandon my original pair and search for another.
I did not have to look far for a superb new upper tramline:
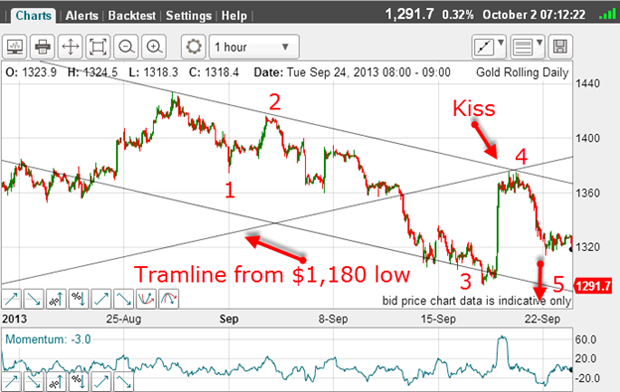
The upper tramline now has the 28 August high as a touch point, which is highly satisfactory. The wave 4 high also hit the underside of the major tramline in a traditional kiss. After the kiss, the market retreated in a 'scalded-cat bounce'.
That was straight out of the textbook.
This decline is likely to be at wave 5, whose low should be below the wave 3 low at $1,291 and ideally close to the lower tramline in the $1,260 $1,280 area.
A mirror image of the wave 4 rally
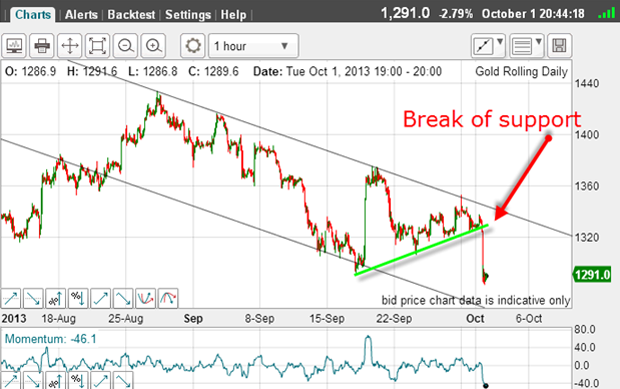
The green line is the trendline joining the several lows from the 18 September low. There were many protective sell stops under this line and these were triggered yesterday with the market down over $40 at one point.
This selling was a mirror image of the wave 4 rally. These large moves both up and down must have cleared out many bulls and bears. I expect Friday's commitment of traders data will reflect that.
A great trade was to enter a short on this trendline break as it was clear wave 5 down was underway.
It appears with yesterday's move below the wave 3 low, the market has done enough work on the downside to complete five waves and to be prepared for the counter-trend rally.
Whether it has more to do or not, the next decent move should be up and this is the position I was in when I wrote my 16 September post only this time, I am looking at a wave 5 low, not a wave 3 low.
The outlook then is for an upward correction in an A-B-C form.
But reading the short-term chart, there may be some more downside to come before we see this rally:
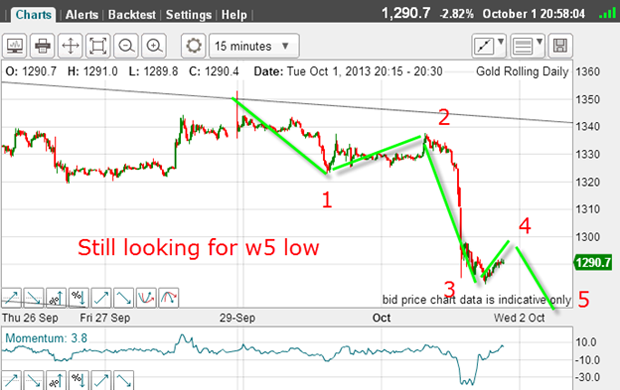
Waves 1, 2 and 3 look good (with a strong wave 3), and as I write, we are seeing a bounce in what should be wave 4.
Under this scenario, wave 5 should make a low under the wave 3 low and a good target would be the $1,260 - $1,280 area I mentioned above. That should set up a good bounce, but with the main trend remaining down, I think it would be wise to sell the rallies.
Get the latest financial news, insights and expert analysis from our award-winning MoneyWeek team, to help you understand what really matters when it comes to your finances.
John is is a British-born lapsed PhD physicist, who previously worked for Nasa on the Mars exploration team. He is a former commodity trading advisor with the US Commodities Futures Trading Commission, and worked in a boutique futures house in California in the 1980s.
He was a partner in one of the first futures newsletter advisory services, based in Washington DC, specialising in pork bellies and currencies. John is primarily a chart-reading trader, having cut his trading teeth in the days before PCs.
As well as his work in the financial world, he has launched, run and sold several 'real' businesses producing 'real' products.
-
 Average UK house price reaches £300,000 for first time, Halifax says
While the average house price has topped £300k, regional disparities still remain, Halifax finds.
-
 Barings Emerging Europe trust bounces back from Russia woes
Barings Emerging Europe trust has added the Middle East and Africa to its mandate, delivering a strong recovery, says Max King