The T-bond market points to big profits
There is an overwhelming belief that interest rates will remain very low for a long time to come. And that opens up what could be a very profitable trade in the markets for US T-bonds, says John C Burford.
Get the latest financial news, insights and expert analysis from our award-winning MoneyWeek team, to help you understand what really matters when it comes to your finances.
You are now subscribed
Your newsletter sign-up was successful
Want to add more newsletters?

Twice daily
MoneyWeek
Get the latest financial news, insights and expert analysis from our award-winning MoneyWeek team, to help you understand what really matters when it comes to your finances.

Four times a week
Look After My Bills
Sign up to our free money-saving newsletter, filled with the latest news and expert advice to help you find the best tips and deals for managing your bills. Start saving today!
Did you hear the Radio 4 interview this morning with a US-based finance professor who stated that public financial markets have "no memory" and that they hold "no discernable patterns that repeat"?
I hope you all spluttered in your coffee when you heard that. I did.
Only an academic with no ability to understand what really makes markets tick could say that. But it has been ever thus. That is one reason why I left academia.
MoneyWeek
Subscribe to MoneyWeek today and get your first six magazine issues absolutely FREE

Sign up to Money Morning
Don't miss the latest investment and personal finances news, market analysis, plus money-saving tips with our free twice-daily newsletter
Don't miss the latest investment and personal finances news, market analysis, plus money-saving tips with our free twice-daily newsletter
I hope I have shown beyond reasonable doubt, through my use of tramlines, Elliott waves and Fibonacci retracements, that not only do markets have good memories, they also have repeatable patterns. And right now, I am showing several in my coverage of the T-bond market.
I have stated that the long-term US Treasury market holds the key to the performance of many major world markets. All traders who trade the medium-to-long-term trends, as I do, need to be aware of this market especially at big market turns, as we are now witnessing.
Previously, I made a case that T-bond yields were almost certainly in the process of bottoming, as Elliott wave counts could be considered complete for the bear market. In fact, I managed to catch the very low in yields with my short T-bond trade.
So how has the market developed since then?
Why it's dangerous to be dogmatic
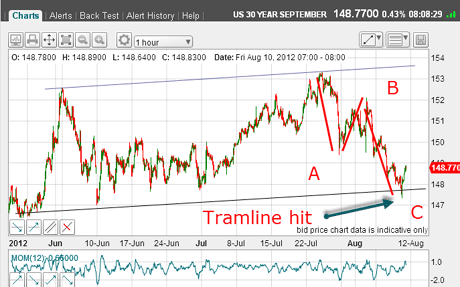
Recall in my article from 10 August that I took a large profit on my short-term trade as the market hit my lower tramline.
This was the situation then:

(Click on the chart for a larger version)
That was a textbook trade. But did the market bounce off the tramline, as I suspected?
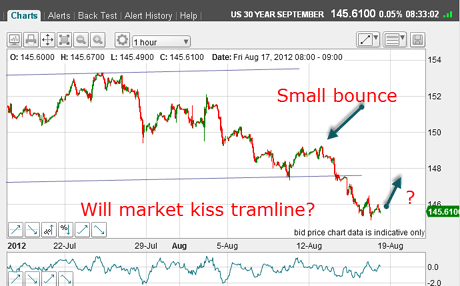
Here is the market as I write:

(Click on the chart for a larger version)
We did get a small bounce, but the market crashed through the tramline as the Dow rallied.
This is a long-term bearish development, I believe. If I am correct, rising long-term interest rates will negatively impact the economy from stocks to housing.
But meanwhile, the T-bonds have been hit hard they are down seven handles (the big number before the decimal point) in less than a month. Prior to the top, it was very difficult to find anyone with a bearish view. The overwhelming belief was that interest rates would remain very low for months perhaps years to come.
Visions of endless quantitative easing (QE) and 'Twist' operations by the Fed would ensure that!
But with this break, I am finding this view being challenged more and more. That is what happens when a market sends a shock wave to dogmatic investors!
But nimble traders, who have no dogmatic view, can benefit from the nervous selling by investors who have had their beliefs dashed by the market.
This is one of the best trading set-ups I look for when there is an overwhelmingly one-sided view which I can trade against using my methods.
This could be a really profitable trade
I believe this trade will go into my 'top 20 trades' gallery.
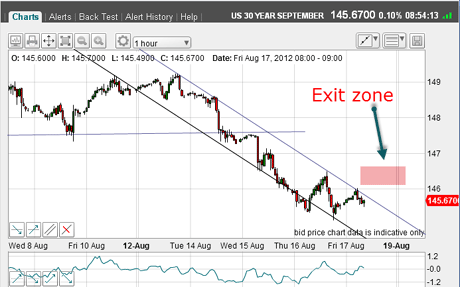
Can the short-term chart tell me anything as to where to take longer-term profits?

(Click on the chart for a larger version)
This is the current wave down from the 149 area, and I have drawn in my tramlines with the lower one having a nice prior pivot point (PPP).
Now, I need to keep an eye on what is occurring over in the Dow, as the two markets trade more-or-less counter-trend. The Dow is currently knocking on the door to new highs, but there is stiff resistance up ahead, so there could be a shift back into the bonds soon. After all, they have been beaten down hard, and many will see this as a great opportunity to buy cheaper bonds.
If so, the market will break above my upper tramline. The move could be sharp, as there is a nice positive momentum divergence in play here.
But note these tramlines have many touch-points there are four on the upper one alone. Does the market have a memory where the tramlines are placed? At the latest touch-point did it know' where the other touch-points were located?
A rally here would get me the tramline kiss I mentioned previously.
A sensible strategy is then for me to place protect-profit buy stops in the pink zone, just above the minor highs.
If I were a more aggressive trader, I may even enter buy stop orders to get long here.
The Dow, having broken into new highs yesterday, may extend the gains somewhat and challenge my upper tramline (shown in recent Dow emails).
I will be looking carefully at the reaction of the T-bonds if this occurs. If the bonds hardly react to the downside, that will give me a bullish signal.
If you're a new reader, or need a reminder about some of the methods I refer to in my trades, then do have a look at my introductory videos:
The essentials of tramline trading
An introduction to Elliott wave theory
Advanced trading with Elliott waves
Don't miss my next trading insight. To receive all my spread betting blog posts by email, as soon as I've written them, just sign up here . If you have any queries regarding MoneyWeek Trader, please contact us here.
Get the latest financial news, insights and expert analysis from our award-winning MoneyWeek team, to help you understand what really matters when it comes to your finances.
John is is a British-born lapsed PhD physicist, who previously worked for Nasa on the Mars exploration team. He is a former commodity trading advisor with the US Commodities Futures Trading Commission, and worked in a boutique futures house in California in the 1980s.
He was a partner in one of the first futures newsletter advisory services, based in Washington DC, specialising in pork bellies and currencies. John is primarily a chart-reading trader, having cut his trading teeth in the days before PCs.
As well as his work in the financial world, he has launched, run and sold several 'real' businesses producing 'real' products.
-
 Average UK house price reaches £300,000 for first time, Halifax says
While the average house price has topped £300k, regional disparities still remain, Halifax finds.
-
 Barings Emerging Europe trust bounces back from Russia woes
Barings Emerging Europe trust has added the Middle East and Africa to its mandate, delivering a strong recovery, says Max King