The secret to successful trading: have a system and stick to it
Whatever your style of trading, you need to stick to a proven system to avoid losing your shirt, says John C Burford. Here, he looks at the Dow Jones's seemingly unstoppable rally, and identifies strategies for both conservative and adventurous traders.
Get the latest financial news, insights and expert analysis from our award-winning MoneyWeek team, to help you understand what really matters when it comes to your finances.
You are now subscribed
Your newsletter sign-up was successful
Want to add more newsletters?

Twice daily
MoneyWeek
Get the latest financial news, insights and expert analysis from our award-winning MoneyWeek team, to help you understand what really matters when it comes to your finances.

Four times a week
Look After My Bills
Sign up to our free money-saving newsletter, filled with the latest news and expert advice to help you find the best tips and deals for managing your bills. Start saving today!
This relentless rally in stock markets has, to me, all the hallmarks of a buying exhaustion.
It is so reminiscent of the heady days of 2007 with massive bullishness of institutional operators in stark contrast to deteriorating economies.
Back then, the US housing bubble had burst and the financial stocks (banks, etc) had already cracked. But the good old Dow kept marching up until it hit the wall at 14,200.
MoneyWeek
Subscribe to MoneyWeek today and get your first six magazine issues absolutely FREE

Sign up to Money Morning
Don't miss the latest investment and personal finances news, market analysis, plus money-saving tips with our free twice-daily newsletter
Don't miss the latest investment and personal finances news, market analysis, plus money-saving tips with our free twice-daily newsletter
Today, we have a similar picture with the US economy in a very weak dead cat bounce', the eurozone in crisis, while here in the UK, we are running on fumes.
But remember, the stock market is not the economy. And my beat is technical trading, so what do I find with the above as backdrop?
Recall in Wednesday's post, the rally had carried past my solid target at 12,400.
Now targets are just that targets. They are minimum goals they can, and sometimes are, exceeded, as here.
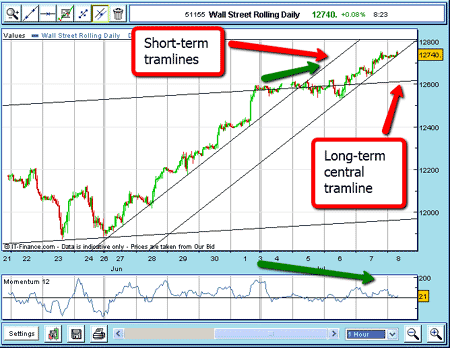
Here is the latest chart:

I have retained the long-term tramlines from my previous email, but have found a new pair of short-term tramlines!
These are the up-sloping lines drawn off the rally from late June.
The upper tramline beautifully provides support until the 5 July break, while the lower tramline has been the support since then.
Note the multiple contact points all along these tramlines with no overthrows.
This is textbook stuff.
The charts are signalling a reversal
But take a look at the form of this latest push since late June:

(Click on the chart for a larger version)
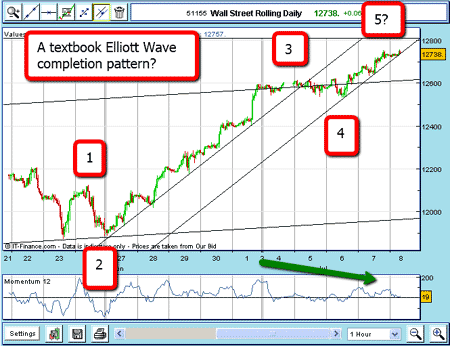
There is a potential five-wave Elliott wave pattern right there.
Waves 1 and 2 are good with wave 2 stopping just above wave 1.
Wave 3 is a long and strong impulse rally on high momentum, wave 4 is a complex correction, and the potential wave 5 is in new high ground while momentum lags the values attained at wave 3.
This is a potential negative momentum divergence, and is a powerful reversal signal.
So, are we setting up for a top? The omens look pretty good, I must say.
Confirmation of a top would come if the market can break back below my long-term central tramline at the 12,600 area.
If I were a conservative trader, I would be looking at this area to enter short trades using a wide stop, but within my 3% rule.
However, if I were more adventurous, I might wish to enter short trades on a break of my lower tramline in the 12,710 area, using the recent high as protective stop.
The risk here would be around 60 pips. This presents quite an unusually low-risk trade.
Using a proven system and sticking to it
Each trader must decide for themselves if they wish to adopt an adventurous (but not reckless!) trading stance, and are willing to be stopped out on their close stops several times before finding a solid entry.
For this strategy to work, you must be able to hold your winning positions through the inevitable gut-wrenching reversals, where you see your profits rapidly dwindle.
For most, this is very difficult to handle. Most traders want to grab a nice profit when they see it regardless of the potential for much larger gains.
But success depends crucially on being able to override your basic impulses.
(I may have more to say on how to train your mental and emotional urges in future posts.)
Or, wishing a more stress-free life, you may adopt a much more conservative approach and decide to wait for the market to prove it has changed course before acting (moving averages are good for this). You would then use much wider stops.
You could walk away and only look at the market once a day (at the end of the session?) and not even glance at your daily equity.
If stopped out, you will calmly reassess.
I know a trader/investor who has great success waiting for the market to confirm a trend and then place very wide stops (he uses 300-500 pips in the Dow, for instance).
Only you can decide the style to adopt that suits your personality. But the key, of course, is to follow a proven system.
And don't worry of you miss a trade there will always be plenty more coming down the lane.
Patience really is a virtue in trading.
Don't miss my next trading insight. To receive all my spread betting blog posts by email, as soon as I've written them, just sign up here .
Get the latest financial news, insights and expert analysis from our award-winning MoneyWeek team, to help you understand what really matters when it comes to your finances.
John is is a British-born lapsed PhD physicist, who previously worked for Nasa on the Mars exploration team. He is a former commodity trading advisor with the US Commodities Futures Trading Commission, and worked in a boutique futures house in California in the 1980s.
He was a partner in one of the first futures newsletter advisory services, based in Washington DC, specialising in pork bellies and currencies. John is primarily a chart-reading trader, having cut his trading teeth in the days before PCs.
As well as his work in the financial world, he has launched, run and sold several 'real' businesses producing 'real' products.
-
 Average UK house price reaches £300,000 for first time, Halifax says
While the average house price has topped £300k, regional disparities still remain, Halifax finds.
-
 Barings Emerging Europe trust bounces back from Russia woes
Barings Emerging Europe trust has added the Middle East and Africa to its mandate, delivering a strong recovery, says Max King