The pound nears my 1.45 target against the dollar
The pound is rising to meet spread betting expert John C Burford's target in the charts. But the bounce could go even higher.
Get the latest financial news, insights and expert analysis from our award-winning MoneyWeek team, to help you understand what really matters when it comes to your finances.
You are now subscribed
Your newsletter sign-up was successful
Want to add more newsletters?

Twice daily
MoneyWeek
Get the latest financial news, insights and expert analysis from our award-winning MoneyWeek team, to help you understand what really matters when it comes to your finances.

Four times a week
Look After My Bills
Sign up to our free money-saving newsletter, filled with the latest news and expert advice to help you find the best tips and deals for managing your bills. Start saving today!
On Friday, I made a case for GBP/USD to stage a rally with a target around 1.45. A rally did indeed materialise, but it was not without drama.
Because this market is not as heavily traded as EUR/USD, it suffers from occasional spikes, where the market drops very suddenly, and then recovers just as quickly (and vice versa).
That is what happened on Monday. Recall that I had identified a daily and weekly key reversal last week, where the market made a new low on the daily and weekly charts and had closed up on the day and week.
MoneyWeek
Subscribe to MoneyWeek today and get your first six magazine issues absolutely FREE

Sign up to Money Morning
Don't miss the latest investment and personal finances news, market analysis, plus money-saving tips with our free twice-daily newsletter
Don't miss the latest investment and personal finances news, market analysis, plus money-saving tips with our free twice-daily newsletter
If genuine, that is a reversal signal and points to a rally phase ahead.
Today, I will explain how I am trading this setup and how I use my money management rules.
As the market rallied, I had identified two levels where long trades could safely be taken at low risk in Friday's post. These were based on the Fibonacci 62% retraces of the previous waves. This was the hourly chart showing these two entries:
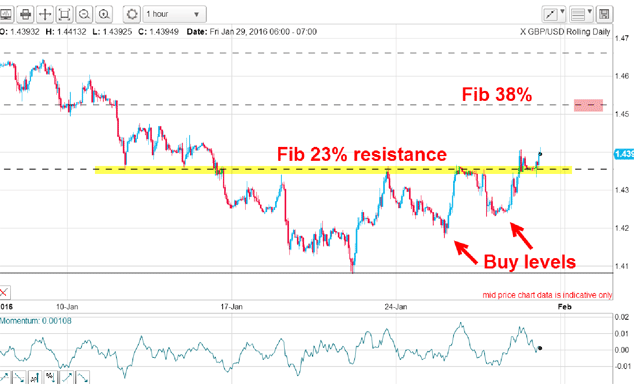
The first long entry carries a protective stop in the 1.4140 area, and the second long entry carries its protective stop in the 1.4190 area.
On Friday morning, the market was looking good and heading upwards towards my 1.45 target. But towards the day's close, heavy dollar buying emerged and drove the market down below the 1.42 level to a low at 1.4150. This is the chart showing the action:
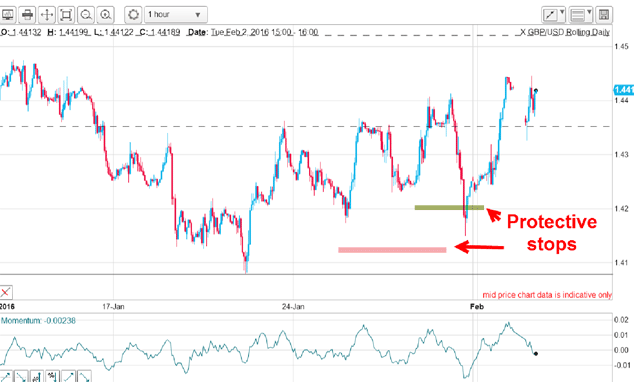
My first protective stop was not touched, but my second one was, taking me out with a loss of around 40 pips on that trade.
But this week, the market has risen like Lazarus and has even exceeded last Friday's high. Friday's plunge was a selling exhaustion with a huge short-covering rally close behind. And the late Friday plunge stopped right at the Fibonacci 78% support level my traditional "last ditch" support level.
That level had to hold, otherwise I would be forced to ditch the key reversal idea. The stakes were very high. I have rarely seen a daily/weekly key reversal that was negated within just a week or two with the market moving to new lows/highs.
Key reversals almost always lead to corrective moves lasting a few weeks at least and that is the scenario I painted when the plunge low held at the Fibonacci 78% support.
Remember, market sentiment is running very bearish and a short squeeze is always on the cards in these circumstances and so a sharp snap-back rally can be anticipated.
On Monday, I was left with a winning trade taken at the 1.4180 level and a 40-pip loss on the second trade a net win (so far). Now, with the market trading well above my first entry, I can move my protective stop to break even.
If the market declines to this stop. I will be left with a 40-pip loss on the first trade and zero loss on the second. That is my worst case scenario.
On Friday, I suggested a target at the 1.45 area. Are we there yet? Here is the latest hourly chart showing my new tramlines:
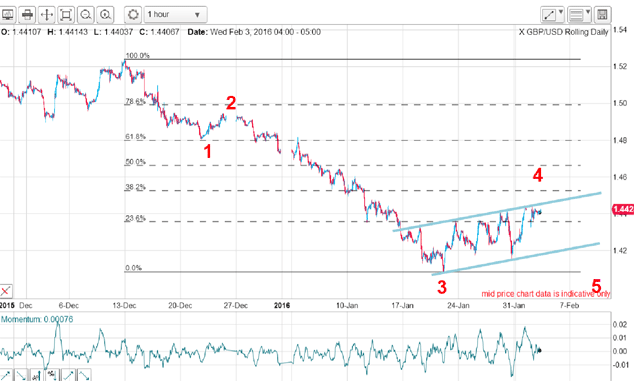
The market is in a relief rally wave 4 up and edging along my upper tramline. Here is a close-up:
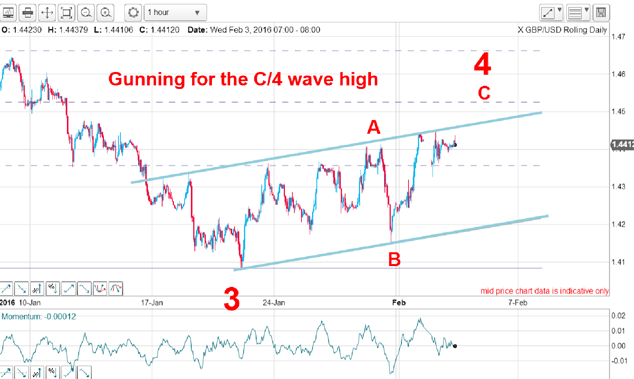
It appears the market may make one more push up closer to the 1.45 level and that should put in my C and 4 wave highs.
If this is correct, the next move will be a wave 5 down taking the market to below the wave 3 low of 1.41.
To put all this in perspective, here is the multi-year chart that shows the market is testing the "last-ditch" Fibonacci 78% support level:
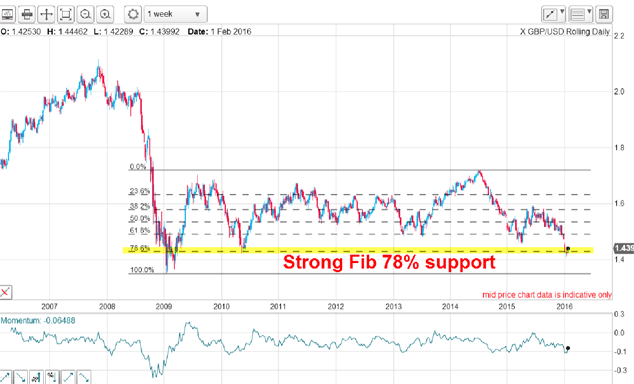
Note that in 2010, this level also provided major support, so it has history. That brings up the possibility that the current bounce could extend much further than my initial 1.45 target.
This could get interesting!
Get the latest financial news, insights and expert analysis from our award-winning MoneyWeek team, to help you understand what really matters when it comes to your finances.
John is is a British-born lapsed PhD physicist, who previously worked for Nasa on the Mars exploration team. He is a former commodity trading advisor with the US Commodities Futures Trading Commission, and worked in a boutique futures house in California in the 1980s.
He was a partner in one of the first futures newsletter advisory services, based in Washington DC, specialising in pork bellies and currencies. John is primarily a chart-reading trader, having cut his trading teeth in the days before PCs.
As well as his work in the financial world, he has launched, run and sold several 'real' businesses producing 'real' products.
-
 Average UK house price reaches £300,000 for first time, Halifax says
While the average house price has topped £300k, regional disparities still remain, Halifax finds.
-
 Barings Emerging Europe trust bounces back from Russia woes
Barings Emerging Europe trust has added the Middle East and Africa to its mandate, delivering a strong recovery, says Max King