Can the pound sterling get off the floor?
Speculators have been falling over themselves to short the pound, says John C Burford. But sterling may have a surprise up its sleeve.
Get the latest financial news, insights and expert analysis from our award-winning MoneyWeek team, to help you understand what really matters when it comes to your finances.
You are now subscribed
Your newsletter sign-up was successful
Want to add more newsletters?

Twice daily
MoneyWeek
Get the latest financial news, insights and expert analysis from our award-winning MoneyWeek team, to help you understand what really matters when it comes to your finances.

Four times a week
Look After My Bills
Sign up to our free money-saving newsletter, filled with the latest news and expert advice to help you find the best tips and deals for managing your bills. Start saving today!
On Wednesday, I wrote that the Dow and FTSE are both swing traders' paradise environments with huge daily moves. I have shown how I have taken significant profits in the Dow (and in crude oil, which I hope to cover next week) in recent days using my very simple tramline methods. But there are other great tradable markets and today, I will cover the GBP/USD market, which is showing a similar degree of scope for profit.
GBP/USD has been in a relentless bear trend for many months and last week made a low at 1.4080 a print last seen in 2009. And there have been plenty of conventional 'reasons' for this weakness from the bear market in crude oil (yes, GBP is a pseudo petro-currency), the huge national debt/GDP ratio and the weak export performance (decline in EU demand) leading to weak balance of payments.
So with such a compelling story, speculators have been falling over themselves to short GBP/USD (and GBP/EUR). And as the market fell further, the speculators piled on more and more short bets so that they are holding more than a 2:1 ratio of short/long futures. Here is the latest Commitments of traders (COT) table:
MoneyWeek
Subscribe to MoneyWeek today and get your first six magazine issues absolutely FREE

Sign up to Money Morning
Don't miss the latest investment and personal finances news, market analysis, plus money-saving tips with our free twice-daily newsletter
Don't miss the latest investment and personal finances news, market analysis, plus money-saving tips with our free twice-daily newsletter
| (Contracts of GBP 62,500) | Row 0 - Cell 1 | Row 0 - Cell 2 | Row 0 - Cell 3 | Open interest: 294,225 | ||||
| Commitments | ||||||||
| 34,336 | 70,509 | 30,860 | 208,285 | 147,135 | 273,481 | 248,504 | 20,744 | 45,721 |
| Changes from 01/12/16 (Change in open interest: 27,173) | ||||||||
| 2,354 | 6,733 | 9,347 | 15,095 | 12,919 | 26,796 | 28,999 | 377 | -1,826 |
| Percent of open in terest for each category of traders | ||||||||
| 11.7 | 24.0 | 10.5 | 70.8 | 50.0 | 92.9 | 84.5 | 7.1 | 15.5 |
| Number of traders in each category (Total traders: 122) | ||||||||
| 28 | 50 | 24 | 26 | 40 | 66 | 102 | Row 8 - Cell 7 | Row 8 - Cell 8 |
Not only that, but in the week ending 19 January, the hedge funds (non-commercials) added a whopping net 4,400 short contracts, so convinced were they that the bear trend would just keep carrying on just like the Duracell bunny.
But that is often a time when nasty reversals are made, as I have shown time after time in other markets. That places the market vulnerable to a short squeeze.
To start my analysis, I examine the long-term picture of the daily chart from the 2014 high at 1.72 for context:
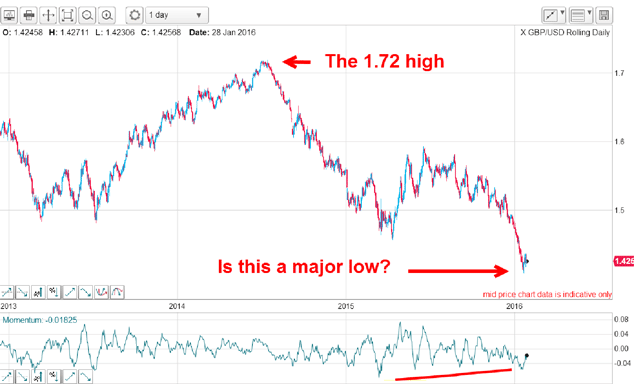
The decline in recent weeks has been relentless and exponential. Here is a close-up:
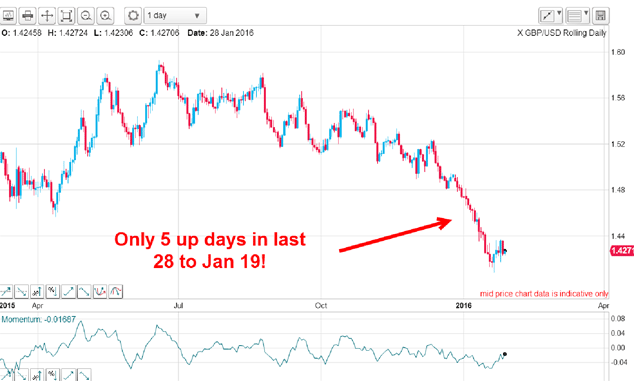
From 14 December to 19 January, there were only five up days (green). That is one stubborn bear trend. Of course, we know that this is unsustainable when too many shorts are piled onto one side of the boat.
Given that I was looking for a sign of a rebound which should be large how did I play it?
I decided that I would wait for a key reversal, if presented. Remember, a key reversal is a day when the market makes a new low but closes up above the previous day's close. They are readily visible using bar charts as well as the more visual candlesticks. And they often indicate selling exhaustion.
And I did not have to wait very long. Last Thursday, the market gave me one beautiful textbook example.
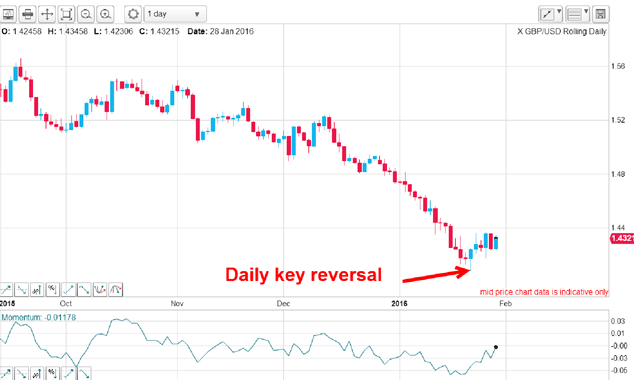
On that day, the market made a new low at just above the round figure 1.40 level, rallied and closed sharply higher on the day. That was precisely what I was looking for. Now I had my reversal, I put together a strategy to get on board. Incidentally, the key reversal also shows up on the weekly chart (new weekly low and a close above the previous week's close) for added verification of a high-probability reversal.
Time to zoom in on the hourly chart:
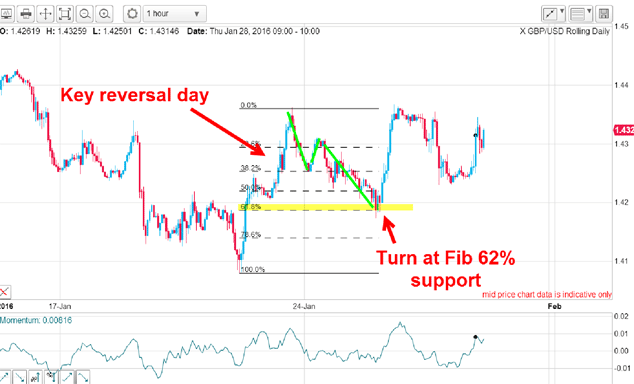
As the market retreated off the key reversal day high, I noted it was taking the familiar A-B-C shape, which is corrective to the one larger trend. Good.
And when it hit the Fibonacci 62% level, that was my signal to pounce and I went long at the 1.42 area. I could afford to use a close protective stop of 40 pips for a low-risk trade.
And right away, the market just took off like a scalded cat from this major support level. That supported my idea that the path of least resistance was now up.
And when the market dipped again, guess where it turned?
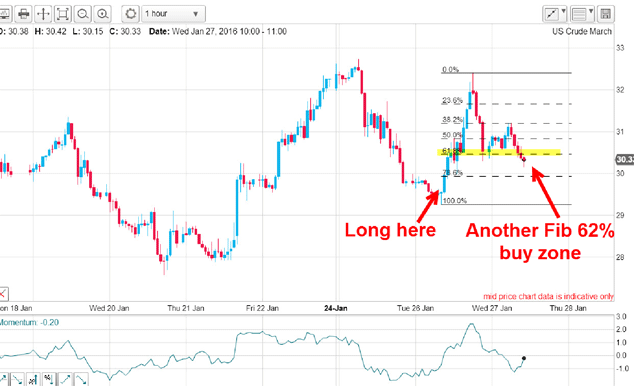
Yes, indeed it fell in another A-B-C to the Fibonacci 62% retrace of the most recent wave! That was another long trade signal.
Here is the hourly chart updated:
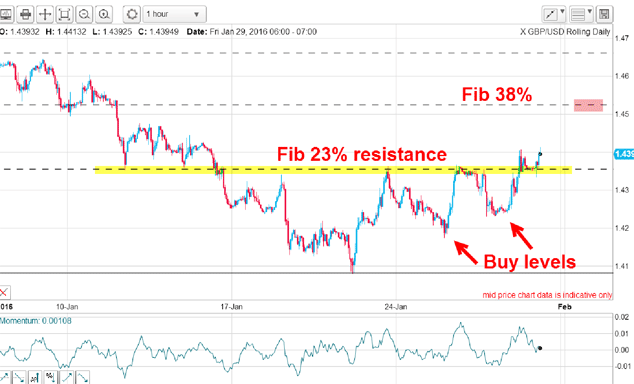
The market has just broken above the important Fibonacci 23% resistance. Note the accurate touch points all along this line. The market regards it as very significant, and so should we. It should now act as support.
Will it go for the next level at the 1.45 area?
Get the latest financial news, insights and expert analysis from our award-winning MoneyWeek team, to help you understand what really matters when it comes to your finances.
John is is a British-born lapsed PhD physicist, who previously worked for Nasa on the Mars exploration team. He is a former commodity trading advisor with the US Commodities Futures Trading Commission, and worked in a boutique futures house in California in the 1980s.
He was a partner in one of the first futures newsletter advisory services, based in Washington DC, specialising in pork bellies and currencies. John is primarily a chart-reading trader, having cut his trading teeth in the days before PCs.
As well as his work in the financial world, he has launched, run and sold several 'real' businesses producing 'real' products.
-
 Average UK house price reaches £300,000 for first time, Halifax says
While the average house price has topped £300k, regional disparities still remain, Halifax finds.
-
 Barings Emerging Europe trust bounces back from Russia woes
Barings Emerging Europe trust has added the Middle East and Africa to its mandate, delivering a strong recovery, says Max King