Join more than 165,000 subscribers and keep yourself informed with the latest financial news, insights and expert analysis to help you understand what really matters when it comes to your finances.
You are now subscribed
Your newsletter sign-up was successful
Want to add more newsletters?
An account already exists for this email address, please log in.
The one indicator that works in every market
Look out for momentum divergences in the charts, says John C Burford. They allow you to time your trades with pinpoint accuracy.
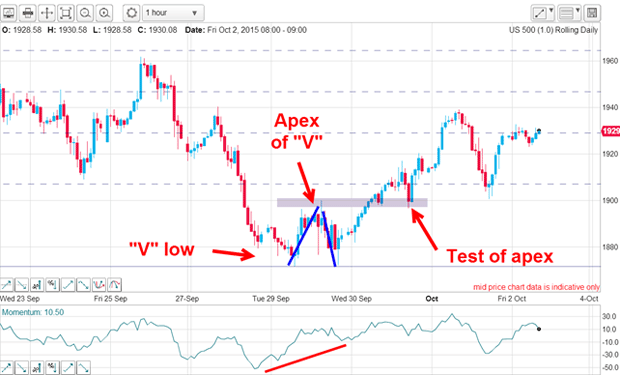
The euphoria of stockmarket investors, prompted by last Friday's stunning US economic reports, has continued into this week. The sharp daily rallies have more than a whiff of short covering about them. But as I wrote on Friday, a big rally phase was flagged long before the reports were released. That gave traders an opportunity to cover at least some shorts and perhaps test the long side.
It was the large momentum divergence the previous week (as highlighted in this chart) that gave the game away:
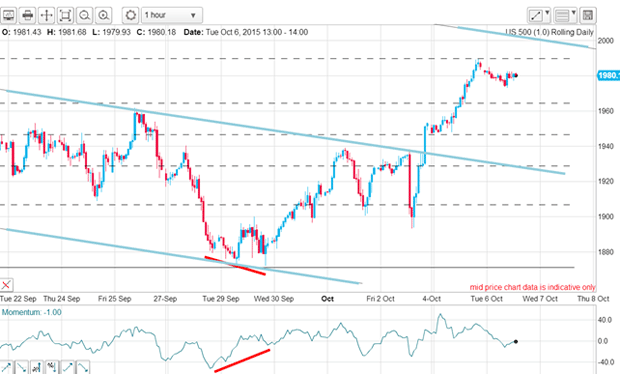
Since then, the market has responded to that momentum divergence stimulus by moving even higher:
Try 6 free issues of MoneyWeek today
Get unparalleled financial insight, analysis and expert opinion you can profit from.
Sign up for MoneyWeek’s free twice-daily newsletter.
Join more than 165,000 subscribers and keep yourself informed with latest financial news, insights and expert analysis to help you understand what really matters when it comes to your finances.
Join more than 165,000 subscribers and keep yourself informed with latest financial news, insights and expert analysis to help you understand what really matters when it comes to your finances.
Remember, I consider this particular indicator valid only when the market has been in a sustained trend and when it appears it often signals the end of that trend and the start of a new one. I rarely use it when the market is in a congestion zone it can give many false signals.
How momentum divergence works
If this high or low is met with renewed buying (or selling), the market will often make a new high (or low) as disappointed new shorts (or longs) combine with stale shorts (or stale longs) who fear the trend will continue.
But if the buying (or selling) pressure is weaker than before, the market will often reverse because selling (or buying) pressure then starts to dominate. This internal process is captured nicely by the simple momentum indicator which registers a lower (or higher) reading on the second leg. This is called a divergence with price.
As prices make new highs (or lows), the momentum fails to confirm the move and give you an instant opportunity to act.
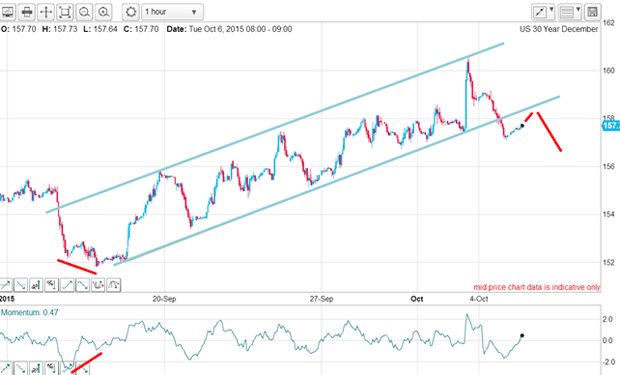
Here is the hourly chart of the T-Bonds (30-year) one of my favourite trading vehicles that shows a magnificent momentum divergence at a recent low. Late last month, the market was trending down in fact, if you peer closely, you will see a small-scale five down on the left-hand side of the chart and the momentum divergence which was massive appears right at the final fifth wave.
The scale of that divergence pointed to a sharp rally, which materialised. Major profits were available for those traders watching this indicator.
Commodities, equities, currencies momentum divergence is always useful
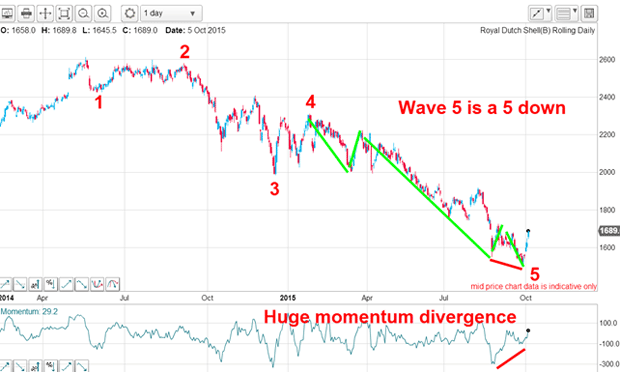
Momentum divergences can also be found in many individual equity charts. Below is the chart for Royal Dutch Shell, on which I have a valid Elliott wave count with the market near the termination of a major fifth wave. In addition, my fifth wave also contains five sub-waves with the final wave possessing a huge momentum divergence:
Remember, the larger the divergence the sharper the recovery. We shall see how high Shell can climb, but already this morning crude oil (US) is trading near the $50 region well up from its recent $38 low.
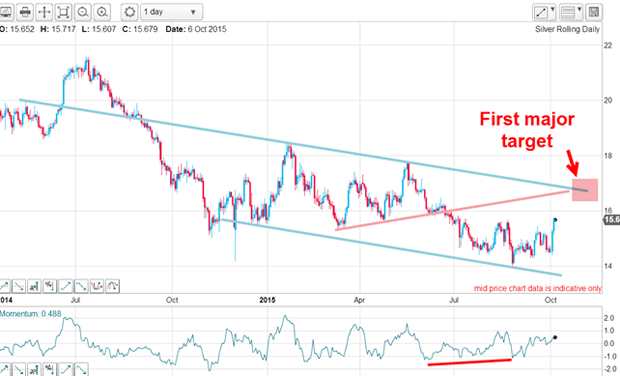
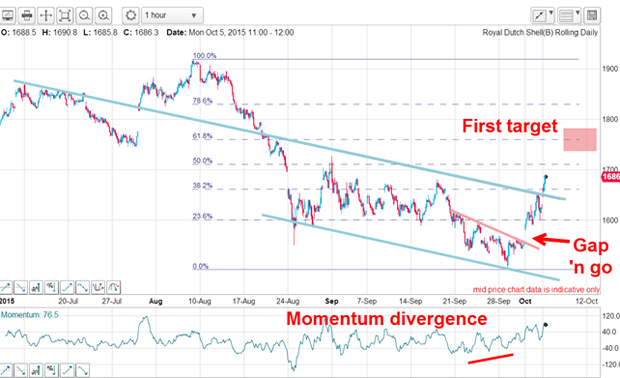
There is even a divergence on Shell's hourly chart. Just as in the example of silver above, I have good tramlines working with a solid momentum divergence at the low:
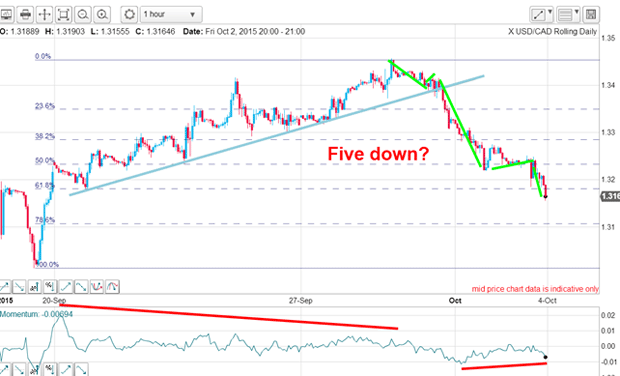
Finally, there is a massive and lengthy divergence in USD/CAD. The Canadian dollar has been hammered along with commodity prices, but with the latter showing signs of life, USD/CAD has plunged by four cents in the past week. There is also a budding momentum divergence presently forming which could possibly signal a rally ahead.
So, in the last few days, we have seen impressive momentum divergence signals in several major markets. And in about every case, these have signalled substantial moves that a swing trader could capitalise on.
This is a very simple, but effective, indicator that any trader can use to pinpoint great trade entries.
Sign up for MoneyWeek's newsletters
Join more than 165,000 subscribers and keep yourself informed with the latest financial news, insights and expert analysis to help you understand what really matters when it comes to your finances.
John is is a British-born lapsed PhD physicist, who previously worked for Nasa on the Mars exploration team. He is a former commodity trading advisor with the US Commodities Futures Trading Commission, and worked in a boutique futures house in California in the 1980s.
He was a partner in one of the first futures newsletter advisory services, based in Washington DC, specialising in pork bellies and currencies. John is primarily a chart-reading trader, having cut his trading teeth in the days before PCs.
As well as his work in the financial world, he has launched, run and sold several 'real' businesses producing 'real' products.