The markets can’t stay in Wonderland forever
As America’s economy weakens, stocks hit new highs. But this ‘Alice in Wonderland’ situation can’t be maintained for ever, says John C Burford. And when the market wakes up, the result should be historic.
Get the latest financial news, insights and expert analysis from our award-winning MoneyWeek team, to help you understand what really matters when it comes to your finances.
You are now subscribed
Your newsletter sign-up was successful
Want to add more newsletters?

Twice daily
MoneyWeek
Get the latest financial news, insights and expert analysis from our award-winning MoneyWeek team, to help you understand what really matters when it comes to your finances.

Four times a week
Look After My Bills
Sign up to our free money-saving newsletter, filled with the latest news and expert advice to help you find the best tips and deals for managing your bills. Start saving today!
It was hard to ignore the news that the Dow has just made an all-time high.
It is getting regular headlines in the financial media and even features prominently on BBC radio news. Curiously, the domestic FTSE is hardly mentioned compared with the Dow.
So now that this market development has become common knowledge, are we finally near the top?
MoneyWeek
Subscribe to MoneyWeek today and get your first six magazine issues absolutely FREE

Sign up to Money Morning
Don't miss the latest investment and personal finances news, market analysis, plus money-saving tips with our free twice-daily newsletter
Don't miss the latest investment and personal finances news, market analysis, plus money-saving tips with our free twice-daily newsletter
Since the start of the year, many pundits have called for a correction but none has been forthcoming. That much was reasonably predictable. After all, when an expectation is widely held, it rarely occurs.
A perverse habit of the markets
Remember the collapse of the euro' motif in recent months as it rallied to the 1.37 area from the 1.20 low last summer? The blogosphere was full of disaster predictions. All the while, as the euro is doomed' chorus played out, the euro was strengthening. What a surprise!
That is one of the perverse habits of markets and one which traders of all types are advised to monitor because tradeable information lurks within.
This behaviour goes hand-in-hand with the idea that sentiment drives markets, of course.
And I advise all traders to keep a watchful eye on sentiment especially when it becomes extreme. And that means monitoring the media as well.
And that brings me back to the current situation in the Dow.
All the while, as many were expecting a correction, it failed to materialise. Markets rarely do what the majority believes.
But now, I detect a lessening of this worry I see fewer articles calling for a downturn. Instead, many are making higher projections.
So now, I am looking out for signs of a top. Will I see one soon?
Two clues to see if the market will top
On Monday, I had a target in the 14,340 region, and that has been hit and now exceeded by around 50 pips as I write.
So how does the picture look this morning?
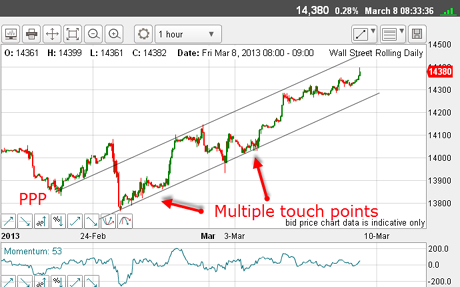
To help, here are the hourly tramlines I have been working of late:

(Click on the chart for a larger version)
The lower line sports many touch points including the nasty head fake of last Friday.
The upper line has the good prior pivot point (PPP), but only a couple of decent touch points.
What to make of this?
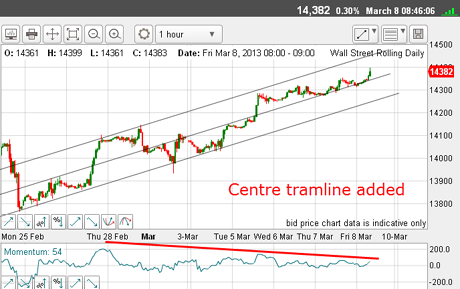
Let's zoom in some more to see a terrific development:

(Click on the chart for a larger version)
I am able to draw a centre tramline, which has many good touch points, and which the market has been trading above since Tuesday.
Note that for some time, momentumhas been weakening. This is a critical sign that the top may be at hand.
Meanwhile, the market seems to be heading towards the upper tramline in the 14,450 14,500 area.
What will give me a clue that market has turned?
The first clue will be a break of the centre tramline, and the second clue would be a break of the lower tramline.
But are the conditions ripe for a turn here?
Remember, I want to see an extreme in sentiment, and one measure is the commitments of traders (COT) data. Here is the latest data as of 26 February:
TABLE.ben-table TABLE {BORDER-BOTTOM: #2b1083 1px solid; BORDER-LEFT: #2b1083 1px solid; BORDER-TOP: #2b1083 1px solid; BORDER-RIGHT: #2b1083 1px solid}TH {TEXT-ALIGN: center; BORDER-LEFT: #a6a6c9 1px solid; PADDING-BOTTOM: 2px; PADDING-LEFT: 1px; PADDING-RIGHT: 1px; BACKGROUND: #2b1083; COLOR: white; FONT-SIZE: 0.8em; FONT-WEIGHT: bold; PADDING-TOP: 2px}TH.first {TEXT-ALIGN: left; BORDER-LEFT: 0px; PADDING-BOTTOM: 2px; PADDING-LEFT: 1px; PADDING-RIGHT: 1px; FONT-SIZE: 0.8em; PADDING-TOP: 2px}TR {BACKGROUND: #fff}TR.alt {BACKGROUND: #f6f5f9}TD {TEXT-ALIGN: center; BORDER-LEFT: #a6a6c9 1px solid; PADDING-BOTTOM: 2px; PADDING-LEFT: 1px; PADDING-RIGHT: 1px; COLOR: #000; FONT-SIZE: 0.8em; PADDING-TOP: 2px}TD.alt {BACKGROUND-COLOR: #f6f5f9}TD.bold {FONT-WEIGHT: bold}TH.date {FONT-SIZE: 0.7em}TD.first {TEXT-ALIGN: left}TD.left {TEXT-ALIGN: left}TD.bleft {TEXT-ALIGN: left; FONT-WEIGHT: bold}
| ($5 X DJIA index) | Row 0 - Cell 1 | Row 0 - Cell 2 | Row 0 - Cell 3 | Open interest: 124,271 | ||||
| Commitments | ||||||||
| 41,708 | 10,844 | 591 | 60,488 | 96,326 | 102,787 | 107,761 | 21,484 | 16,510 |
| Changes from 19/02/13 (Change in open interest: 664) | ||||||||
| 3,701 | 265 | 411 | -3,930 | -1,148 | 182 | -472 | 482 | 1,136 |
| Percent of open interest for each category of traders | ||||||||
| 33.6 | 8.7 | 0.5 | 48.7 | 77.5 | 82.7 | 86.7 | 17.3 | 13.3 |
| Number of traders in each category (Total traders: 114) | ||||||||
| 38 | 19 | 5 | 38 | 29 | 77 | 52 | Row 8 - Cell 7 | Row 8 - Cell 8 |
The non-commercials mainly hedge funds, who are primarily trend-followers are massively long, and even added to long positions in that week.
That is clue number one.
And here are a few more:
Trading volumes have been weak on the rally, showing less conviction.
The sell/buy ratio of company insiders is at a record high do they know something the hedgies don't?
Bullish consensus data from all of the major polling firms point to record or near-record bullishness, and levels seen previously where major turns occurred.
At times such as these, where is the buying coming from that is making the new highs?
It is from fresh buying and short-covering of the amazed bears.
The markets have to wake up soon
Remember, the stock market is running on liquidity, and the bulls expect the Fed to keep the pumps working overtime forever.
But is this a realistic expectation? The Fed has promised to maintain the quantitative easing (QE) operations until unemployment has declined to 6.5%. While the prospect of reaching this goal remains slim, at least in the short-term, the view is that the Fed should keep supporting stocks.
What a perverse result! A weakening economy translates into higher stocks.
Earlier today, the closely-watched US employment data was released for February, showing US unemployment at its lowest level since December 2008. Let's watch closely to see how the markets will react.
But this Alice in Wonderland situation will not be maintained for ever, and at some point, the market will see that long bond yields are rising contrary to the Fed's wishes - and that the Fed is not the all-powerful driver of the economy and stocks.
And when the market wakes up, the result should be historic.
If you're a new reader, or need a reminder about some of the methods I refer to in my trades, then do have a look at my introductory videos:
The essentials of tramline trading
An introduction to Elliott wave theory
Advanced trading with Elliott waves
Don't miss my next trading insight. To receive all my spread betting blog posts by email, as soon as I've written them, just sign up here . If you have any queries regarding MoneyWeek Trader, please contact us here.
Get the latest financial news, insights and expert analysis from our award-winning MoneyWeek team, to help you understand what really matters when it comes to your finances.
John is is a British-born lapsed PhD physicist, who previously worked for Nasa on the Mars exploration team. He is a former commodity trading advisor with the US Commodities Futures Trading Commission, and worked in a boutique futures house in California in the 1980s.
He was a partner in one of the first futures newsletter advisory services, based in Washington DC, specialising in pork bellies and currencies. John is primarily a chart-reading trader, having cut his trading teeth in the days before PCs.
As well as his work in the financial world, he has launched, run and sold several 'real' businesses producing 'real' products.
-
 Average UK house price reaches £300,000 for first time, Halifax says
While the average house price has topped £300k, regional disparities still remain, Halifax finds.
-
 Barings Emerging Europe trust bounces back from Russia woes
Barings Emerging Europe trust has added the Middle East and Africa to its mandate, delivering a strong recovery, says Max King