The market hasn’t bottomed out just yet
Markets have been rocked by big falls in recent days, says John C Burford. Elliott wave theory suggests investors aren't out of the woods yet.
Get the latest financial news, insights and expert analysis from our award-winning MoneyWeek team, to help you understand what really matters when it comes to your finances.
You are now subscribed
Your newsletter sign-up was successful
Want to add more newsletters?

Twice daily
MoneyWeek
Get the latest financial news, insights and expert analysis from our award-winning MoneyWeek team, to help you understand what really matters when it comes to your finances.

Four times a week
Look After My Bills
Sign up to our free money-saving newsletter, filled with the latest news and expert advice to help you find the best tips and deals for managing your bills. Start saving today!
They say that nothing exceeds like excess and with Black Monday's record-shattering 1,000-point opening swoon in the Dow in New York, I felt that was a tad excessive and gave the 'buy the dip' boys a great reason to jump in with both feet.
But is this time different?
Have they caught a bottom again?
MoneyWeek
Subscribe to MoneyWeek today and get your first six magazine issues absolutely FREE

Sign up to Money Morning
Don't miss the latest investment and personal finances news, market analysis, plus money-saving tips with our free twice-daily newsletter
Don't miss the latest investment and personal finances news, market analysis, plus money-saving tips with our free twice-daily newsletter
I had anticipated a big down day on Monday, because on Friday night, following a week of heavy losses, I drew this chart showing my target for the current wave:
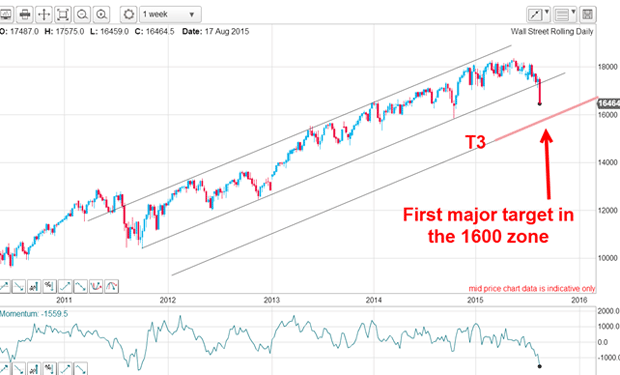
I had been working these tramlines for several years and realised that they were so reliable that if the lower line were to be broken, that should herald a rapid decline to my T3 target (drawn equidistant).
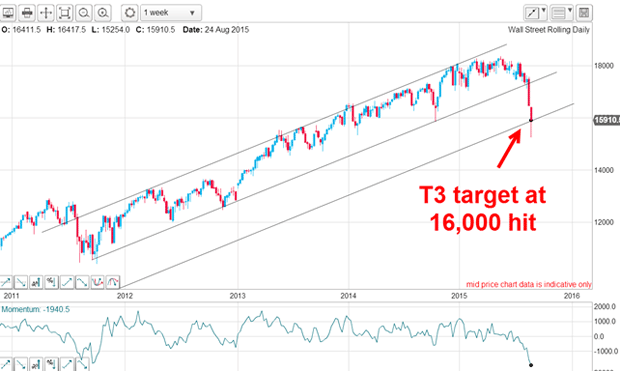
Lo and behold, within a few hours my target at the 16,000 area was hit, and much sooner than I had expected. That happy event resulted in big profits on my shorts. This was the chart yesterday morning in the aftermath of 'Black Monday':
The banner headlines yesterday morning screamed with terms such as 'bloodbath', 'financial crisis' and 'financial crash', and lots of photos of traders jumping out of windows (figuratively). Of course last week, I read few articles with such apocalyptic headlines even though the Dow was quietly dropping by over 1,000 points. It took Monday's dramatic plunge (and recovery) to highlight the 'crisis' for journalists.
So does this mean the worst is over now that the banner headlines could not possibly get any bigger?
If you have been following my Elliott wave coverage, you will not have been surprised by the huge losses we are in a third wave and these are long and strong. Here is the current daily chart of the Dow:
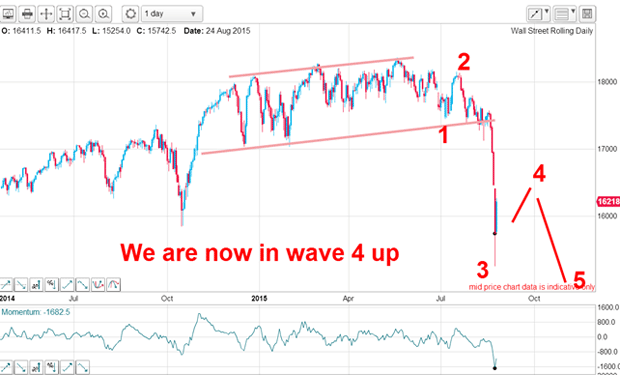
The plunge selling climax on Monday is my wave 3 low and it certainly qualifies as a long and strong wave. Momentum is oversold and the market is currently bouncing up in wave 4.
When wave 4 terminates, I expect a fresh wave of selling taking the market to below the wave 3 low in wave 5. And when wave 5 terminates, I expect a huge counter-trend rally. That is my roadmap at present.
Analysts are still in denial about the market's problems
This highlights the common misconception that the market is driven by the economic news. It isn't. And that is why bear markets get started most are puzzled by the 'sudden' turnaround and remain bullish because they can't understand why the market has done the dirty on them. Eventually, they see the bear is serious and will start selling, providing more fuel for the declines.
Last week, I pointed out that the market had devalued the yuan much more than the authorities had admitted with their 2% claim. Western markets are rightly concerned that the yuan will plunge rapidly, here is a telling chart of the yuan/USD rate:
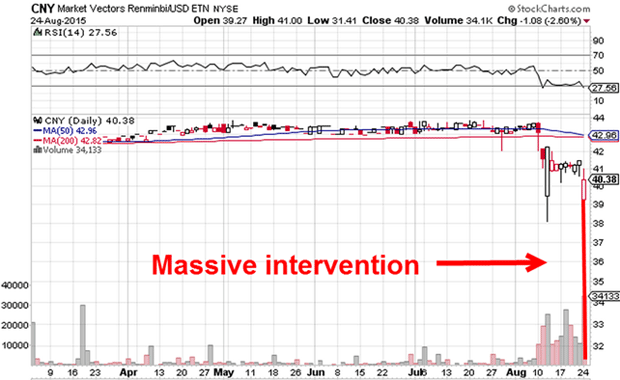
Black Monday produced a plunge to the 30 area, but with gigantic intervention by the Chinese authorities, the market was pulled back up to the 40 area a massive rebound of 30% in one day!
I guess when you have $4trn in your back pocket to spend, you can swing the market around a bit.
But the burning question is this: how far will the current wave 4 rally carry on?
Can commodities get up off the floor?
Here is the hourly Dr Copper, which has just made a new six-year low:
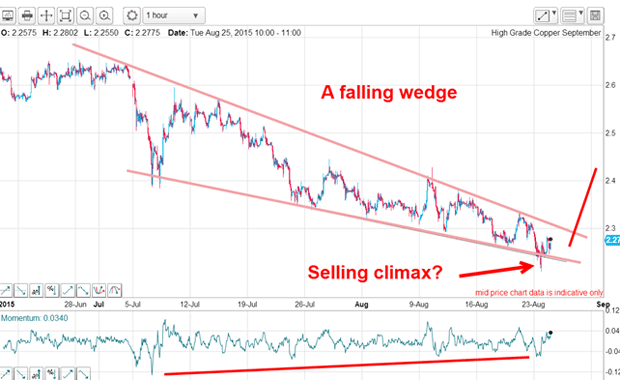
It is still falling inside the descending wedge, but on Monday it spiked below the lower wedge line and immediately recovered. That could be a selling climax.
If the market can move above the upper wedge line, it would be very constructive, and signal the low is likely in. A massive short squeeze could then get under way (in much the same way as occurred in gold recently).
And how about that other key commodity crude oil? The hourly chart there shows a very similar pattern:
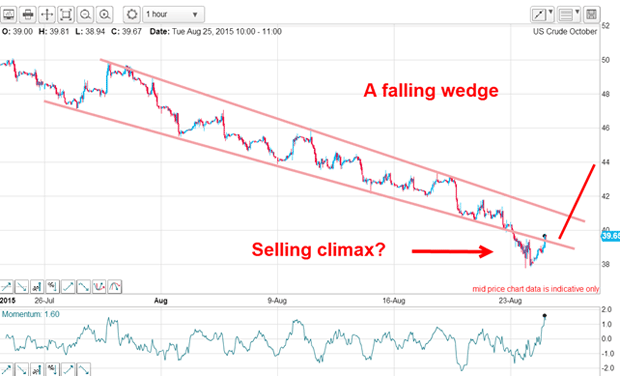
Here too, the potential for a short squeeze is high.
This summer is proving anything but dull!
Get the latest financial news, insights and expert analysis from our award-winning MoneyWeek team, to help you understand what really matters when it comes to your finances.
John is is a British-born lapsed PhD physicist, who previously worked for Nasa on the Mars exploration team. He is a former commodity trading advisor with the US Commodities Futures Trading Commission, and worked in a boutique futures house in California in the 1980s.
He was a partner in one of the first futures newsletter advisory services, based in Washington DC, specialising in pork bellies and currencies. John is primarily a chart-reading trader, having cut his trading teeth in the days before PCs.
As well as his work in the financial world, he has launched, run and sold several 'real' businesses producing 'real' products.
-
 MoneyWeek Talks: The funds to choose in 2026
Podcast Fidelity's Tom Stevenson reveals his top three funds for 2026 for your ISA or self-invested personal pension
-
 Three companies with deep economic moats to buy now
Opinion An economic moat can underpin a company's future returns. Here, Imran Sattar, portfolio manager at Edinburgh Investment Trust, selects three stocks to buy now