The euro is testing my tramlines
The euro has hit a major milestone, and is testing John C Burford's tramlines. This may indicate a turning point, and the charts are providing plenty of opportunities for profit.
Get the latest financial news, insights and expert analysis from our award-winning MoneyWeek team, to help you understand what really matters when it comes to your finances.
You are now subscribed
Your newsletter sign-up was successful
Want to add more newsletters?

Twice daily
MoneyWeek
Get the latest financial news, insights and expert analysis from our award-winning MoneyWeek team, to help you understand what really matters when it comes to your finances.

Four times a week
Look After My Bills
Sign up to our free money-saving newsletter, filled with the latest news and expert advice to help you find the best tips and deals for managing your bills. Start saving today!
I'm embarrassed by riches this morning! I can pick between superb tramline lessons in the euro, gold, or the Dow. All three of my markets are following the script so far. But it has been a while since I covered the euro - so the euro it is.
But first, I wish to refer back to some points I mentioned recently about the timeframe we choose when trading. As you know, I write in these MoneyWeek Trader articles on aspects of swing trading. I consider this to be a short-to-medium-term timeframe (hours and days). I hope I show that the methods I employ are very well suited to this type of trading and show how to find your own profit-making entries.
All traders must discover for themselves which timeframe they are most comfortable in. Most novice traders seem to start with short timeframes because that is where the second-to-second action is. How exciting to see live tick-by-tick moves and you can see it almost 24 hours a day! They have the latest hi-tech wizardry and scores of technical indicators and believe that this will ensure success. It all looks so easy.
MoneyWeek
Subscribe to MoneyWeek today and get your first six magazine issues absolutely FREE

Sign up to Money Morning
Don't miss the latest investment and personal finances news, market analysis, plus money-saving tips with our free twice-daily newsletter
Don't miss the latest investment and personal finances news, market analysis, plus money-saving tips with our free twice-daily newsletter
But my advice will always be to begin with swing trading and then graduate to other timeframes if you wish. There are numerous advantages to swing trading.
Here are some:
Can set entry orders while away from your screen (using stop or limit entries).
Can set reasonable targets, often based on pre-determined chart points. These can be set beforehand.
No need to be staring at your screen for hours on end (this can induce madness, I hear). No seat-of-the-pants decisions required.
Can set pre-determined maximum loss per trade (3% rule) so no surprises when stopped out! This is the low-stress way.
Profits on good trades can be large, enabling a gradual build-up of account size a proper business-like approach.
And can use my tramline, Elliott wave, and Fibonaccimethods with ease.
What more could a trader need in the pursuit of making money?
In a later article, I will go into why traders need to keep simplifying their approach and reduce their data intake to the absolute minimum, despite the siren calls from the web.
Inching toward my long-term target
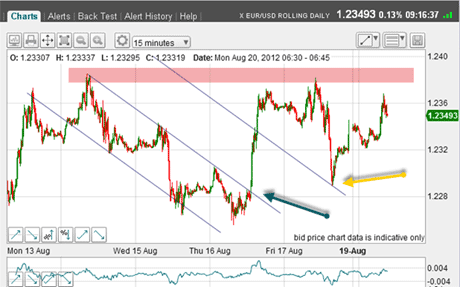
OK, in my previous 20 August article on the euro - The euro may surprise the bears- I made a case that this surprise was for an extension of the counter-trend rally. This was the chart back then:

(Click on the chart for a larger version)
I had an ideal long trade at the blue arrow and another at the tramline kiss (yellow arrow). The line in the sand for the bears was the pink bar at previous highs.
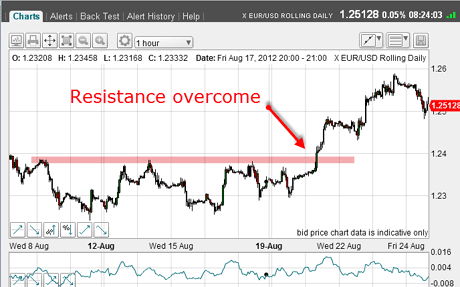
Did the market overcome that resistance? Let's see:

(Click on the chart for a larger version)
As I suspected, we saw a thrusting break through the 1.24 level with a quick run-up to the 1.26 area.
For late-comers, this was another place to enter a long trade.
I had a long-standing target in the 1.26-1.27 region, so we were getting close.
Now, with this rally, can I now find clues to detect a top target?
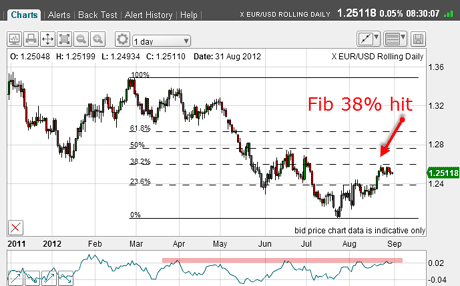
When trading, I like to keep my eye on the daily chart for perspective:

(Click on the chart for a larger version)
And guess what? The rally has made it to an important Fibonacci level where the top pivot point is the last major top. That is a major milestone and may indicate a turning point, especially with momentum having reached levels previously identified with tops (pink bar).
The tramline break marking the end of this rally
Now. Let's zero in on the shorter timescale:

(Click on the chart for a larger version)
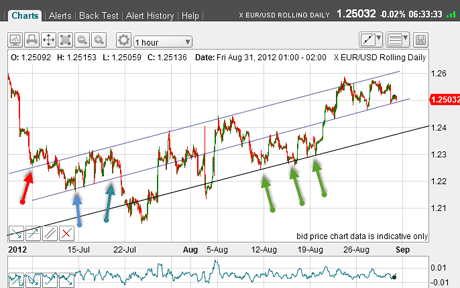
This is the July-August rally on the hourly chart and I have drawn a very acceptable tramline trio. The top line was quite easy to put in with the prior pivot point (PPP) (red arrow) and covering all the tops since early July.
The centre tramline came next, also sporting good PPPs (blue arrows) and with the great very recent low touch-points.
The lowest tramline was last with the excellent mid-August lows as touch-points.
Using my tramline trading rules, I was looking for a short trade near the highest tramline.
This morning as I write, the market is testing the centre tramline. If that breaks, my first target is the lowest tramline in the 1.24 region.
And breaking that tramline would almost certainly spell the end of the rally and the next surprise should be occurring in the bull camp.
The euro, although making many tricky zigzags in this rally, is amenable to analysis using my tramline and Fibonacci methods and is providing good profit opportunities.
If you're a new reader, or need a reminder about some of the methods I refer to in my trades, then do have a look at my introductory videos:
The essentials of tramline trading
An introduction to Elliott wave theory
Advanced trading with Elliott waves
Don't miss my next trading insight. To receive all my spread betting blog posts by email, as soon as I've written them, just sign up here . If you have any queries regarding MoneyWeek Trader, please contact us here.
Get the latest financial news, insights and expert analysis from our award-winning MoneyWeek team, to help you understand what really matters when it comes to your finances.
John is is a British-born lapsed PhD physicist, who previously worked for Nasa on the Mars exploration team. He is a former commodity trading advisor with the US Commodities Futures Trading Commission, and worked in a boutique futures house in California in the 1980s.
He was a partner in one of the first futures newsletter advisory services, based in Washington DC, specialising in pork bellies and currencies. John is primarily a chart-reading trader, having cut his trading teeth in the days before PCs.
As well as his work in the financial world, he has launched, run and sold several 'real' businesses producing 'real' products.
-
 ISA fund and trust picks for every type of investor – which could work for you?
Whether you’re an ISA investor seeking reliable returns, looking to add a bit more risk to your portfolio or are new to investing, MoneyWeek asked the experts for funds and investment trusts you could consider in 2026
-
 The most popular fund sectors of 2025 as investor outflows continue
It was another difficult year for fund inflows but there are signs that investors are returning to the financial markets