The euro is heading towards my targets
A combination of three chart trading methods revealed highly accurate targets in the euro charts, says John C Burford.
Get the latest financial news, insights and expert analysis from our award-winning MoneyWeek team, to help you understand what really matters when it comes to your finances.
You are now subscribed
Your newsletter sign-up was successful
Want to add more newsletters?

Twice daily
MoneyWeek
Get the latest financial news, insights and expert analysis from our award-winning MoneyWeek team, to help you understand what really matters when it comes to your finances.

Four times a week
Look After My Bills
Sign up to our free money-saving newsletter, filled with the latest news and expert advice to help you find the best tips and deals for managing your bills. Start saving today!
Last Wednesday, I covered the zigs and zags of the EUR/USD market in its very tricky wave 4 phase. I explained how fourth waves require extra special care and if you are not very careful, these waves can be a drag on your trading performance. In fact, I would say that they are the greatest traders' graveyards of all waves.
In comparison, third waves are a doddle if you can jump aboard early enough. These are like riding a tiger by its tail. You wake up and almost every day, you see another gain when you switch on. These are dream waves and if you concentrated on finding only these potential third waves, you will have a very robust trading plan, provided you also have a solid money management regime.
This fourth wave in the euro has been operating since the March low of last year. And in that time, there have been only a few really great low-risk trade setups that have produced gains of several hundreds of pips. And last week, I showed the latest of these.
MoneyWeek
Subscribe to MoneyWeek today and get your first six magazine issues absolutely FREE

Sign up to Money Morning
Don't miss the latest investment and personal finances news, market analysis, plus money-saving tips with our free twice-daily newsletter
Don't miss the latest investment and personal finances news, market analysis, plus money-saving tips with our free twice-daily newsletter
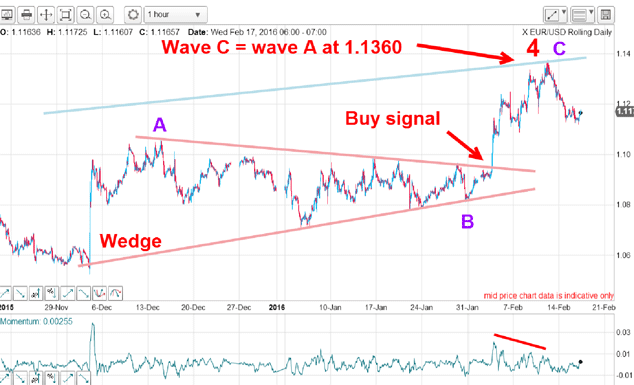
Here is the chart I showed last time:

Since December, the first great trade was going long at the start of the wedge on Draghi Day for a possible gain of 200300 pips. Then a long wait while the wedge was quietly forming, and then the second great buy signal on 3 February as the market crashed up out of the wedge for another possible gain of 300400 pips.
But the standout feature of the chart is the extreme accuracy of my upside target at 1.1360. I arrived at this target using three independent methods, as I explained last week.
To recap, these targets are:
A hit on the Fibonacci 38% retrace of the wave down off the wave 2 high.
A hit on the underside of a major tramline in a kiss.
And equality of waves A and C.
My firm conclusion was that after hitting this target, the market would resume its decline in a new wave 5. I had found the top of wave 4 after a tortuous journey from the wave 3 low made back in March last year.
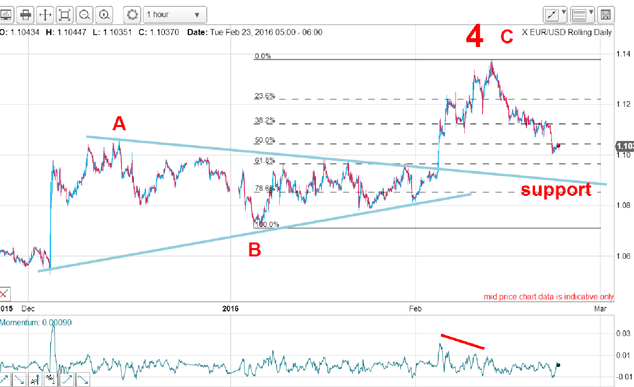
And this is the current hourly chart:

In the past week, the market has obliged by declining another 100200 pips and now trades over 300 pips below the 1.1360 high.
The market is currently heading towards the extension of the blue upper wedge line, which now has become support (it was strong resistance while the market was trading within the wedge). That is my immediate target.
But that wedge contains a heck of a lot of congestion. That means any downside progress is likely to be likewise congested and that means there should be some decent bounces where trades could be initiated.
How does all this fit into the bigger picture now?
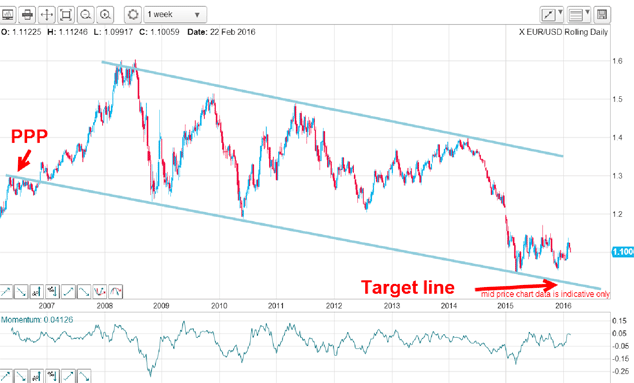
Here is the weekly chart back to 2006:

These are the broad tramlines I see working with the lower line almost textbook. It has a superb set of prior pivot points (PPPs) in 2006 and three accurate touch points in the previous ten years.
Who says markets don't have long memories? To doubters, just show them this chart. The latest bounce off lower tramline support in 2015 was precise and occurred nine years after the PPPs.
But now with the market in retreat, my major target is back on that line. So depending on when it gets there will determine the target price level. If the market takes its time, the support will kick in at a lower level than otherwise.
But an eyeball reading puts that point at around parity. So that is my major target.
Get the latest financial news, insights and expert analysis from our award-winning MoneyWeek team, to help you understand what really matters when it comes to your finances.
John is is a British-born lapsed PhD physicist, who previously worked for Nasa on the Mars exploration team. He is a former commodity trading advisor with the US Commodities Futures Trading Commission, and worked in a boutique futures house in California in the 1980s.
He was a partner in one of the first futures newsletter advisory services, based in Washington DC, specialising in pork bellies and currencies. John is primarily a chart-reading trader, having cut his trading teeth in the days before PCs.
As well as his work in the financial world, he has launched, run and sold several 'real' businesses producing 'real' products.
-
 ISA fund and trust picks for every type of investor – which could work for you?
Whether you’re an ISA investor seeking reliable returns, looking to add a bit more risk to your portfolio or are new to investing, MoneyWeek asked the experts for funds and investment trusts you could consider in 2026
-
 The most popular fund sectors of 2025 as investor outflows continue
It was another difficult year for fund inflows but there are signs that investors are returning to the financial markets