Will the euro reach parity this time?
Traders hoping for euro parity with the dollar were disappointed last time. Is history about to repeat itself? John C Burford examines the charts.
Get the latest financial news, insights and expert analysis from our award-winning MoneyWeek team, to help you understand what really matters when it comes to your finances.
You are now subscribed
Your newsletter sign-up was successful
Want to add more newsletters?

Twice daily
MoneyWeek
Get the latest financial news, insights and expert analysis from our award-winning MoneyWeek team, to help you understand what really matters when it comes to your finances.

Four times a week
Look After My Bills
Sign up to our free money-saving newsletter, filled with the latest news and expert advice to help you find the best tips and deals for managing your bills. Start saving today!
The last time I covered a currency market was on 5 February when I described how I was playing the GBP/USD swings. Today, I thought I would go back to the EUR/USD because it is showing some classic chart patterns that are pretty textbook and are giving excellent trading signals.
Since the dramatic key reversal on 3 December out of a bear trend, EUR/USD has been tracing out a complex pattern that I have been able to follow.
Let me recap where we are in the wave pattern on the daily chart:
MoneyWeek
Subscribe to MoneyWeek today and get your first six magazine issues absolutely FREE

Sign up to Money Morning
Don't miss the latest investment and personal finances news, market analysis, plus money-saving tips with our free twice-daily newsletter
Don't miss the latest investment and personal finances news, market analysis, plus money-saving tips with our free twice-daily newsletter

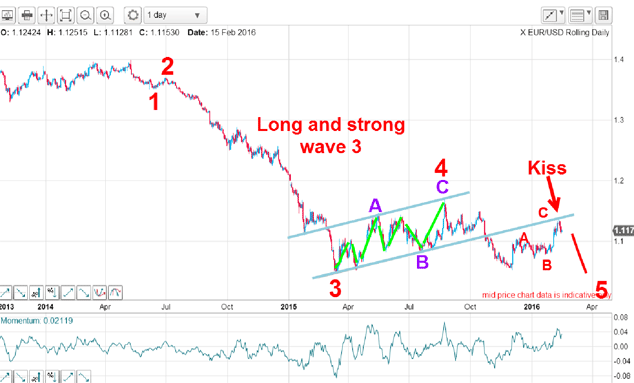
This is the current picture. The market declined off the 1.40 top in May 2014 with the bulk of the fall in a typical long and strong wave 3. Following this highly directional move I expected a complex wave 4, which is commonly found after a decline of this magnitude. My expectation has been fully borne out. It is anything but a simple A-B-C.
In fact, it has been very tricky getting the timing of highs and lows right and the direction. But my tramline method of analysis has generally kept me on the right side. Less experienced traders should always trade smaller in these difficult conditions because it is so easy to be zigging when you should be zagging.
This constant zig-zagging in wave 4 is a result of the titanic battle being waged between the bulls and the bears. During the third wave, the bears were in total control with only minor successes for the bulls as they managed to produce only small counter-trend rallies.
But as the euro collapsed towards parity last March, many bears started taking major profits by covering their shorts and with new bullish entrants believing the currency was undervalued, those two factors helped stop the rot.
As the market was plunging under the 1.10 area, many pundits were forecasting sub-parity. In one of my poststhen, I suggested that would not occur and forecasted a recovery. And since the wave 3 low last year, the fight has been pretty even.
As wave 4 progressed, I was able to label it as an A-B-C pattern, which is my ideal form for a fourth wave (see above chart). In addition, I could draw in an excellent tramline pair.
This is a close-up of waves 3 and 4:

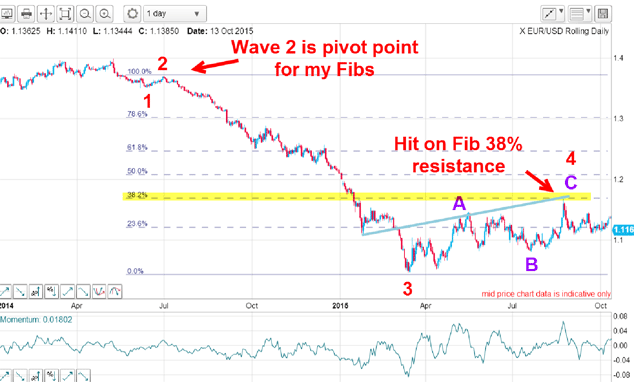
When dealing with fourth waves, I always set out my Fibonacci levels in order to give me some possible upside targets. Because wave A did not reach even the 38% level, I believed wave 4 had not completed and expected a dip in wave B and then a new rally in wave C. That did occur and not only did wave C reach the 38% resistance level, that was also the point where it hit the upper tramline resistance.
That was an area of doubly-strong resistance and an excellent place to enter short trades. And that set off the start of the final wave 5 down to below the wave 3 low.
Note that I set my Fibonacci levels using the wave 2 high as my upper pivot point (this option is covered in my book, Tramline Trading).
The market declined and then broke below my lower tramline last October another shorting signal. The market continued down until Draghi Day on 3 December, when his shock news sent the euro soaring (just when bearish sentiment had reached an extreme).
Since then the market has carved out an A-B-C with the C wave planting a traditional kiss on the lower tramline (see top chart). That was another short trade signal.
Here is a close up of recent action and it shows a new and remarkably accurate target:

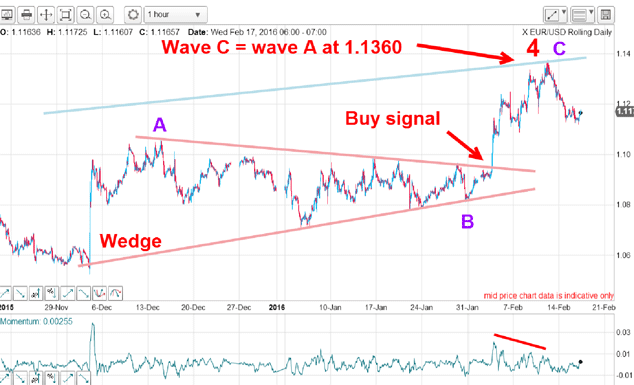
The B wave is a simple wedge and the thrust up out of it last month was another highly reliable trade signal (buy). That thrust was my final C wave and when it turned at the 1.1360 level, which was also the precise measured target in the wave equality rule. In counter-trend rallies, waves A and C are often of equal height.
So that 1.1360 level was the target for the C wave rally based on three separate methods. That level possesses super-strong resistance, and odds are very high that I have found the wave 4 high and the trend is now down. Also note the momentum divergence going into the 1.1360 high.
Later today, the monthly US Federal Reserve minutes will be released, and these reports often affect the dollar with volatility on the rise. If the market can move below the 1.11 support area, that should signal the downtrend remains in place. But what I would like to see is a small five down off the 1.1360 high. That would add to my confidence.
Get the latest financial news, insights and expert analysis from our award-winning MoneyWeek team, to help you understand what really matters when it comes to your finances.
John is is a British-born lapsed PhD physicist, who previously worked for Nasa on the Mars exploration team. He is a former commodity trading advisor with the US Commodities Futures Trading Commission, and worked in a boutique futures house in California in the 1980s.
He was a partner in one of the first futures newsletter advisory services, based in Washington DC, specialising in pork bellies and currencies. John is primarily a chart-reading trader, having cut his trading teeth in the days before PCs.
As well as his work in the financial world, he has launched, run and sold several 'real' businesses producing 'real' products.
-
 ISA fund and trust picks for every type of investor – which could work for you?
Whether you’re an ISA investor seeking reliable returns, looking to add a bit more risk to your portfolio or are new to investing, MoneyWeek asked the experts for funds and investment trusts you could consider in 2026
-
 The most popular fund sectors of 2025 as investor outflows continue
It was another difficult year for fund inflows but there are signs that investors are returning to the financial markets