The Dow Jones has hit the top – what now?
The Dow Jones has topped out at 12,800, reckons John C Burford. Now that it's in a downtrend, what's the best way to take advantage?
Get the latest financial news, insights and expert analysis from our award-winning MoneyWeek team, to help you understand what really matters when it comes to your finances.
You are now subscribed
Your newsletter sign-up was successful
Want to add more newsletters?

Twice daily
MoneyWeek
Get the latest financial news, insights and expert analysis from our award-winning MoneyWeek team, to help you understand what really matters when it comes to your finances.

Four times a week
Look After My Bills
Sign up to our free money-saving newsletter, filled with the latest news and expert advice to help you find the best tips and deals for managing your bills. Start saving today!
Despite so much going on in the euro and gold markets, I will take over the Dow reins this morning, as it is confirming my forecast that the recent 12,800 high was indeed the top, as I said in Monday's email: Did 12,800 mark the top for the Dow Jones?
My view was (and remains) that the Dow has started a new downtrend and that trading should be carried out from the short side.
Trading Tip: When looking for an entry point for short trades, wait for the market to rally to the underside of a tramline, or level of resistance. If the rally is in the C wave of an A-B-C pattern, so much the better. In this case, you may wish to increase the size of your bet. Protective stops can then be placed somewhat closer than you normally would.
MoneyWeek
Subscribe to MoneyWeek today and get your first six magazine issues absolutely FREE

Sign up to Money Morning
Don't miss the latest investment and personal finances news, market analysis, plus money-saving tips with our free twice-daily newsletter
Don't miss the latest investment and personal finances news, market analysis, plus money-saving tips with our free twice-daily newsletter
If you cannot constantly watch the screen, then you can place resting limit orders. If unsure of how to do this, your spread betting firm will have tutorials for you.
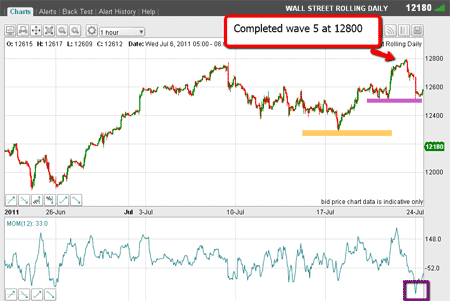
Now, one key to my bearish view is the completed fifth wave of a clear five-wave Elliott wave pattern at 12,800. Here was the position on Monday on the hourly chart:

(Click on the chart for a larger version)
Now, the more aggressive traders would have shorted the market (or sold their longs) close to where the market had confirmed a new high at 12,800.
This is not what most traders do they get more bullish as new highs are made.
Trading Tip: This is a constant refrain with me to be successful, you need to become more bearish as prices rise, looking for signs of tops. Just this week, I gave a terrific example of herding in the gold just as the market topped!
More conservative traders would be looking for additional confirmation of a trend change by setting sell orders just below support in the 12,500 area (marked by the purple bar).
And even more conservative traders would be wanting even more confirmation by setting sell orders under the previous 12,300 low (marked by the yellow bar).
Naturally, there is a significant price to pay for this insurance'. At 12,500, that is 300 pips off the high. Where to place protective stops?
And at the 12,300 level, that is 500 pips off the high. The later into a new trend you decide to enter, the more likely you are of being stopped out on the inevitable sharp rallies.
Which means, you must decide what type of trader you are!
I tend to be pretty aggressive at times like this, and if I do get it right, I take comfort in knowing that I have a low initial risk and can move my stop quickly to break even.
Also, by being early into a new trend, I can look for rallies to add to short positions, looking for the downtrend to resume. If the 12,800 high holds, my positions will always be in profit a good place to be.
If you are entering lower down, you run a high risk that a sharp counter-trend rally could produce a loss and adding to positions would probably be suicidal.
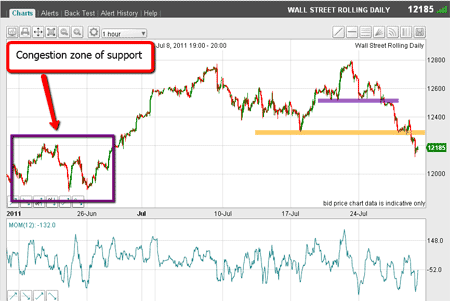
OK, where are we this morning? Here is the hourly chart:

(Click on the chart for a larger version)
From the deeply oversold momentum reading on Monday (marked by the purple box in the first chart), the market attempted a rally, but the 12,500 support eventually gave way. Then the 12,300 support gave way yesterday and the market is currently trading under 12,200.
So far, so good for the bearish camp there are 600 pips off last Friday's high.
Watch for sharp rallies
But we must expect sharp counter-trend rallies at some point. Can we use our chart-based methods to forecast when this is likely to occur? I believe we can.
Incidentally, I advise any trader not to be distracted by the political developments swirling around. Markets do not follow the news, but the news follows the markets.
In the above chart, I have marked with a purple box the area of congestion that should act as a brake to the downtrend. That, at least, should give some support from a short-term oversold condition.
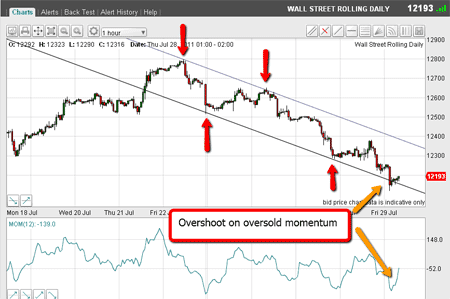
But I have another tool at my disposal my tramlines. Here they are:

(Click on the chart for a larger version)
I have two pairs of touch points (one pair on the top tramline, one on the bottom each marked with red arrows) and the market early this morning has overshot the lower tramline on oversold momentum. This is a signal to me to expect a rally from here.
At this early stage, I am not sure how high it will carry, but short-term traders who shorted near the top will be banking a very nice 600+ pip profit.
So, this week, I have stuck my neck out and managed to pick the 12,800 Dow top, and the $1,628 gold top.
Next week, I will cover the euro, which is also showing topping behaviour. Until then.
Don't miss my next trading insight. To receive all my spread betting blog posts by email, as soon as I've written them, just sign up here .
Get the latest financial news, insights and expert analysis from our award-winning MoneyWeek team, to help you understand what really matters when it comes to your finances.
John is is a British-born lapsed PhD physicist, who previously worked for Nasa on the Mars exploration team. He is a former commodity trading advisor with the US Commodities Futures Trading Commission, and worked in a boutique futures house in California in the 1980s.
He was a partner in one of the first futures newsletter advisory services, based in Washington DC, specialising in pork bellies and currencies. John is primarily a chart-reading trader, having cut his trading teeth in the days before PCs.
As well as his work in the financial world, he has launched, run and sold several 'real' businesses producing 'real' products.
-
 ISA fund and trust picks for every type of investor – which could work for you?
Whether you’re an ISA investor seeking reliable returns, looking to add a bit more risk to your portfolio or are new to investing, MoneyWeek asked the experts for funds and investment trusts you could consider in 2026
-
 The most popular fund sectors of 2025 as investor outflows continue
It was another difficult year for fund inflows but there are signs that investors are returning to the financial markets