Did 12,800 mark the top for the Dow Jones?
John C Burford looks at some very interesting tramline and Elliott wave patterns in the Dow Jones as it approaches a critical point in the charts.
Get the latest financial news, insights and expert analysis from our award-winning MoneyWeek team, to help you understand what really matters when it comes to your finances.
You are now subscribed
Your newsletter sign-up was successful
Want to add more newsletters?

Twice daily
MoneyWeek
Get the latest financial news, insights and expert analysis from our award-winning MoneyWeek team, to help you understand what really matters when it comes to your finances.

Four times a week
Look After My Bills
Sign up to our free money-saving newsletter, filled with the latest news and expert advice to help you find the best tips and deals for managing your bills. Start saving today!
With political developments coming thick and fast from both the eurozone and from the USA, the currency and stock markets are anything but tranquil this summer.
The Dow is near a critical chart juncture as I write early this Monday morning, throwing up some very interesting tramline and Elliott wave relationships.
Incidentally, I prefer the Dow as I have found it gives the most reliable chart patterns and signals of all the major stock indexes. There are plenty of other indexes out there, but I like to keep things simple.
MoneyWeek
Subscribe to MoneyWeek today and get your first six magazine issues absolutely FREE

Sign up to Money Morning
Don't miss the latest investment and personal finances news, market analysis, plus money-saving tips with our free twice-daily newsletter
Don't miss the latest investment and personal finances news, market analysis, plus money-saving tips with our free twice-daily newsletter
I do keep an eye on some of the others, such as the FTSE, FTSE 250, S&P and Nasdaq in order to observe any divergences. But for trading purposes, it's the Dow for me.
Kissing the lines another way to identify trades
I last covered the Dow on 11 July: Profit from the Dow Jones whichever way it heads.
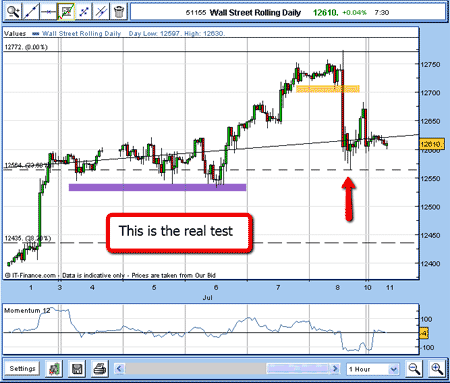
Back then, the market was challenging my long-term central tramline here is the chart:
(Click on the chart for a larger version)
As I said on the chart, the purple bar represents good support, but if broken, the market should fall.
And this is what happened:
(Click on the chart for a larger version)
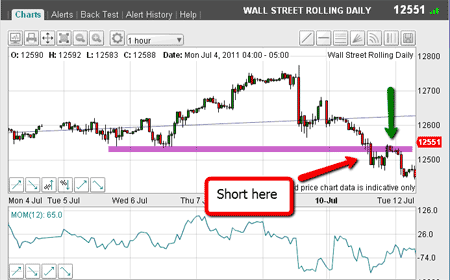
The market did indeed break below my purple support line where short positions were indicated.
And note how the market then pulled back to the underside of this support (marked by green arrow), and then peeled away.
This tendency to kiss' support or resistance lines can be used as a second opportunity to place trades.
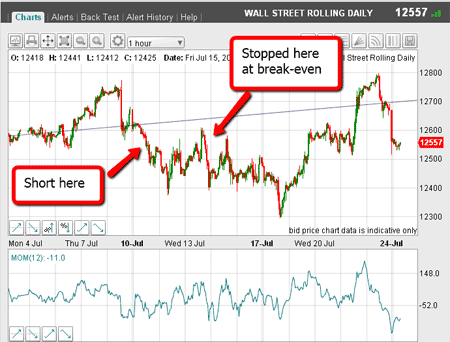
The market then continued to decline, which gave an opportunity to move protective stops to break even using my break even rule.
So, let's update the chart to this morning:
(Click on the chart for a larger version)
During a rally phase on 13 July, those short trades were stopped out at break-even. But the market was very choppy and short-term traders were happy to be out of the market during this time.
But last Thursday, the market caught a bid and pushed up strongly through my central tramline. I did not expect that!
Of course, with break even stops in place, surprises need not be nasty ones.
A powerful reversal signal
However, this morning, the market has dropped back through the tramline.
This is a very volatile market and just what I had anticipated while the politicians are making headlines in their efforts to save the world (again).
But let's take a step back and look at the bigger picture.
(Click on the chart for a larger version)
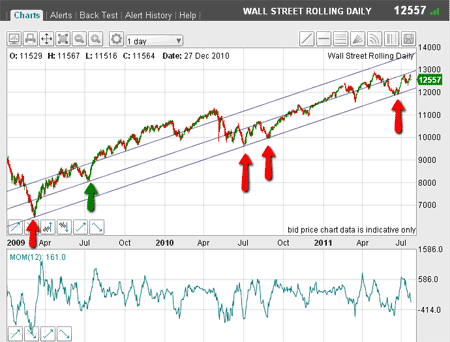
Here is the daily chart going back to 2009. I can draw a very good tramline connecting the important lows (marked by red arrows).
Then, I can draw a parallel line connecting the important July 2009 low and it passes right through the recent highs.
Here it is in close-up:
(Click on the chart for a larger version)
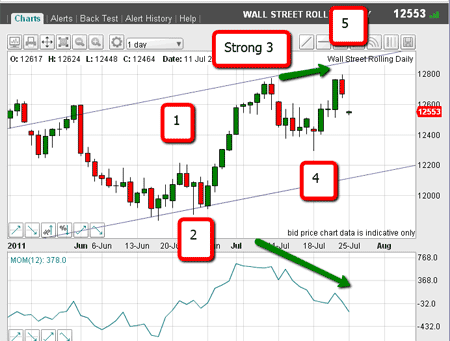
From the mid-June low, I can count five Elliott waves, which appear textbook. We have a very powerful wave 3, which is the longest and strongest wave, and a new high (but only just!) at 12,800 last Friday and on a very strong negative momentum divergence.
When we have five completed Elliott waves, we normally get a reversal of some sort. It is a very powerful reversal signal.
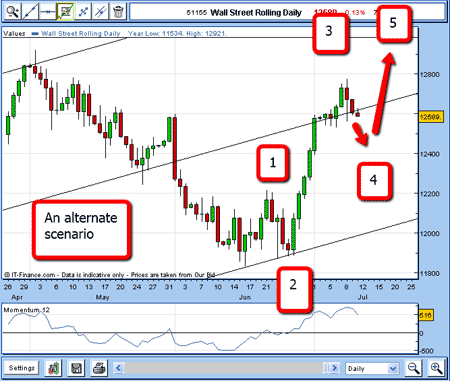
It is worth recalling that in my 11 July post, I gave this as my alternate scenario, which has now come to pass. Here is the chart from that email:
(Click on the chart for a larger version)
On Friday, alert traders would have been noting the day's 12,800 high as the possible end of wave 5.
So now I have very strong evidence that the market has topped.
Both long-term and short-term traders without positions will now be looking to short on rallies, but using protective stops, of course.
Gold has continued its rally this morning, making new highs. But it is pushing against a very long-term tramline, so it is at a critical point. I hope to show these features later this week.
Don't miss my next trading insight. To receive all my spread betting blog posts by email, as soon as I've written them, just sign up here .
Get the latest financial news, insights and expert analysis from our award-winning MoneyWeek team, to help you understand what really matters when it comes to your finances.
John is is a British-born lapsed PhD physicist, who previously worked for Nasa on the Mars exploration team. He is a former commodity trading advisor with the US Commodities Futures Trading Commission, and worked in a boutique futures house in California in the 1980s.
He was a partner in one of the first futures newsletter advisory services, based in Washington DC, specialising in pork bellies and currencies. John is primarily a chart-reading trader, having cut his trading teeth in the days before PCs.
As well as his work in the financial world, he has launched, run and sold several 'real' businesses producing 'real' products.
-
 MoneyWeek Talks: The funds to choose in 2026
Podcast Fidelity's Tom Stevenson reveals his top three funds for 2026 for your ISA or self-invested personal pension
-
 Three companies with deep economic moats to buy now
Opinion An economic moat can underpin a company's future returns. Here, Imran Sattar, portfolio manager at Edinburgh Investment Trust, selects three stocks to buy now