You are now subscribed
Your newsletter sign-up was successful
Want to add more newsletters?

Twice daily
MoneyWeek
Get the latest financial news, insights and expert analysis from our award-winning MoneyWeek team, to help you understand what really matters when it comes to your finances.

Four times a week
Look After My Bills
Sign up to our free money-saving newsletter, filled with the latest news and expert advice to help you find the best tips and deals for managing your bills. Start saving today!
First, I want to thank the super group of traders who attended yesterday's Trader workshop, all of whom came to learn and who brought up many great situations in the charts, which we investigated at length. I really enjoyed the day!
One of the situations we discussed was the Dow. In my lastpost on 8 March, I was looking for a top.
MoneyWeek
Subscribe to MoneyWeek today and get your first six magazine issues absolutely FREE

Sign up to Money Morning
Don't miss the latest investment and personal finances news, market analysis, plus money-saving tips with our free twice-daily newsletter
Don't miss the latest investment and personal finances news, market analysis, plus money-saving tips with our free twice-daily newsletter
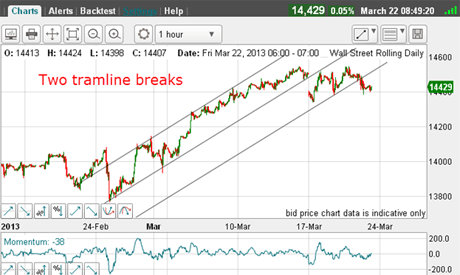
See the chart below for my tramlines then.
The market was making new highs above the centre tramline. But it was living on borrowed time! Buying power, as measured by the momentum reading, was waning.
I wrote: "Meanwhile, the market seems to be heading towards the upper tramline in the 14,450-14,500 area."
And that is precisely what happened.

(Click on the chart for a larger version)
I also said: "What will give me a clue that market has turned?
"The first clue will be a break of the centre tramline, and the second clue would be a break of the lower tramline."
So let's fast forward to this morning. Here are my tramlines, as before:
(Click on the chart for a larger version)
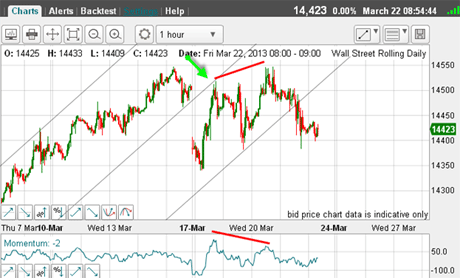
Well, well. There are my two tramline breaks and a most definite one on Monday with that large gap down on the opening.
Let's zoom in and take a closer look:
(Click on the chart for a larger version)
Last Friday, the market extended to the 14,550 level on Monday, broke the centre tramline, but then recovered to fill the gap a common event.
It then made a very pretty kiss on the underside of the centre tramline (green arrow) before peeling away to touch the lower tramline, where it met support that is what tramlines do! to make an A-B-C bounce pattern.
This kiss precisely on the line validates it as a significant tramline and gives me added confidence in it.
It then hit resistance again at Friday's high and yesterday, broke below the lower tramline.
One other clue: last week the market failed to reach the upper tramline, which was a sign of weakness in the rally.
We also have a negative-momentum divergence on the bounce (red bars).
So my conditions have been met, and now I am confident that the Dow has turned.
How do we trade this?
The right trades were, of course, to short the market on these tramline breaks and on the C wave high near 14,550 for the more aggressive trader.
Is there anything in the charts that could spoil this scenario?
Well, a rally to the underside of the lower tramline would be perfectly normal and would not alter the more bearish picture.
But a rally well into the trading channel would be of more concern. That would be a natural place to put protective stops.
Short-term trading opportunities?
Now we have movement off the highs, can I see any new shorter-term tramlines? Here is the 15-minute chart:
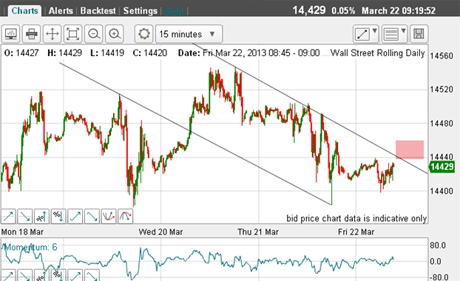
(Click on the chart for a larger version)
And what superb tramlines I have! The lower one has a prior pivot point (PPP) right on a rally spike and the touch point is the recent spike low. Who says the market has no memory?
Then, my upper tramline gratifyingly hits those three precise touch points with the market currently approaching the tramline again.
A break of the upper line would not be disastrous because my projected upper rally limit for the kiss on the hourly tramline is in the 14,500 region.
If the market did reach the pink zone, it could well run up to this area, where a possible short trade lurks.
At present all we have is a three-wave move down, which could result in an A-B-C. If so, as this is a counter-trend pattern, the uptrend would be expected to be intact.
I think the way to play this is to probe the short side, but to use close stops.
And a break of support at 14,380 level would raise the odds considerably that a significant top was in place, and more substantial moves to the downside beckon. Why is that? Here are the Fibonacci levels:
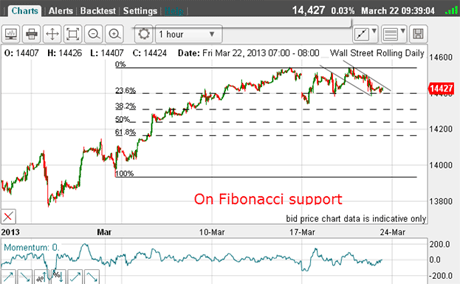
(Click on the chart for a larger version)
We are currently in a bounce off Fibonacci 23% support. If that breaks, the next level is in the 14,300 area with the 50% correction around the 14,200 level.
But a move to a new high would almost certainly be the last gasp of the bull run.
Finally, it has been a strange feature of stock markets in recent years that major turns often appear right around the two annual solstices. Check out the daily charts to confirm!
If you're a new reader, or need a reminder about some of the methods I refer to in my trades, then do have a look at my introductory videos:
The essentials of tramline trading
An introduction to Elliott wave theory
Advanced trading with Elliott waves
Don't miss my next trading insight. To receive all my spread betting blog posts by email, as soon as I've written them, just sign up here . If you have any queries regarding MoneyWeek Trader, please contact us here.
-
 Average UK house price reaches £300,000 for first time, Halifax says
While the average house price has topped £300k, regional disparities still remain, Halifax finds.
-
 Barings Emerging Europe trust bounces back from Russia woes
Barings Emerging Europe trust has added the Middle East and Africa to its mandate, delivering a strong recovery, says Max King

