The big question for gold traders
The gold market has been trading in a fairly wide range recently. But something has to give soon. John C Burford examines the charts for signs of the next direction.
Get the latest financial news, insights and expert analysis from our award-winning MoneyWeek team, to help you understand what really matters when it comes to your finances.
You are now subscribed
Your newsletter sign-up was successful
Want to add more newsletters?

Twice daily
MoneyWeek
Get the latest financial news, insights and expert analysis from our award-winning MoneyWeek team, to help you understand what really matters when it comes to your finances.

Four times a week
Look After My Bills
Sign up to our free money-saving newsletter, filled with the latest news and expert advice to help you find the best tips and deals for managing your bills. Start saving today!
As traders, I reckon we should keep in mind a wonderful quote attributed to Einstein: "Not everything that counts can be counted, and not everything that can be counted counts".
This was obviously not at the forefront of the minds of algorithmic traders (aka maths geeks) in view of the high-speed trading glitch disaster last week on the NYSE.
You may recall the May 2010 'flash crash', where the Dow plunged by almost 1,000 points in seconds before quickly recovering. Many attributed this to high-speed trading, since many of the computers were similarly programmed to sell at the market at the same time. Such is the immense power of these machines today.
MoneyWeek
Subscribe to MoneyWeek today and get your first six magazine issues absolutely FREE

Sign up to Money Morning
Don't miss the latest investment and personal finances news, market analysis, plus money-saving tips with our free twice-daily newsletter
Don't miss the latest investment and personal finances news, market analysis, plus money-saving tips with our free twice-daily newsletter
We traders are at the mercy of these beasts, unfortunately. But our advantage is that we can heed Einstein's maxim and, using a proven methodology, keep it simple in stark contrast to the high-speed algo users who delight in devising complex formulae.
But let's get back to the charts
Something has to give in the gold market
It's time we checked back on our old favourite: gold. The market has been in a wide-ish trading range recently and I want to examine the charts for signs of the next direction.
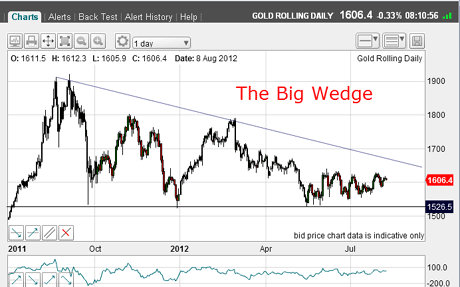
Here is the updated daily chart showing the 'big wedge' I have been following:

(Click on the chart for a larger version)
Since the May $1,530 major support low, which held, the market has been trying to edge up towards the upper line, lying today at the $1,675 region about $70 above this morning's market.
Swing trading in this period has been tough, and I have been mostly on the sidelines. But as the apex of the wedge approaches closer, something has to give.
Will the upper wedge line give way to massive buying, or will the solid support at the $1,530 level break on selling?
That is the medium-to-long term question. But before either of these levels is reached, the market must negotiate the short-term areas of support and resistance.
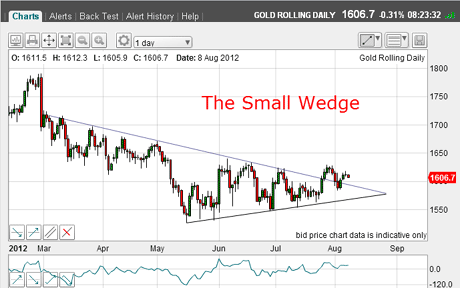
Here is the chart of trading since March:

(Click on the chart for a larger version)
Since the May $1,530 low, the market has etched out a lovely wedge let's call this the 'small wedge'.
This one has a slightly different form from the big wedge, which is really a horizontal triangle, sporting a horizontal lower boundary. The small wedge has both lines sloping, which is a classic wedge form.
Is this a real move in gold?
See how last week, the market poked above the upper line, retreated back down below it, and is currently trading above it.
But first, note the numerous very accurate touch-points on both lines. I consider these lines very significant.
So the question is: Has the upper wedge line been truly broken implying a bull move or is this a head fake (as we know, very common in gold)?
One of the rules attached to trading wedges is this: If the market waits to break out of the wedge close to its apex, the move out is often much weaker than otherwise.
Has this break-out occurred too close to the apex implying a weak rally?
The other point I raise to question the validity of this upward break is this: on Monday, I made a strong case for why the charts indicated that the euro rally was about to fizzle out. Because of the solid relationship between the two markets, it would be highly unusual for the euro to weaken and gold to rally at least for any length of time.
Let's now examine the shorter-range chart to look for clues:

(Click on the chart for a larger version)
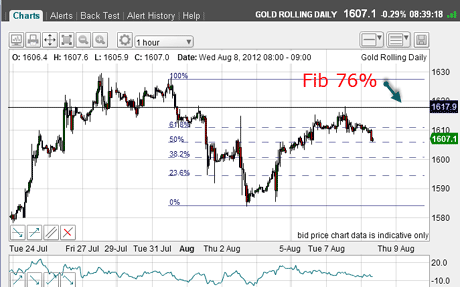
It shows trading around the upward break (I have not shown the wedge line for clarity). Right away, this week's rally has carried to the precise Fibonacci76% retrace of the most recent wave down off the $1,630 high.
My high pivot point is the most recent significant high (slightly lower than Friday's high).
Trader tip: When looking for Fibonacci levels, go for the most recent significant highs and lows. These will give you the most active levels.
Also, the form of the rally to this level is an A-B-C, although not textbook in form.
That was an excellent place to put out a short trade with the protective stop just above the $1,630 level for a low-risk trade.
Of course, without using tramlines in this trade, I am operating without the benefit of my full armoury. Sometimes, as an experienced trader, I do work in this way but I much prefer to use all three: tramlines, Elliott waves and Fibonacci, as I did in Monday's euro trade.
If you're new to trading, I strongly recommend you use all three methods for all your trades. In time, when you become more confident and experienced, you can go off-piste.
But whatever you do, follow your strict money management rulesto avoid catastrophic loss.
The line could stop gold moving higher
Before I go, one other piece of information has given me pause:

(Click on the chart for a larger version)
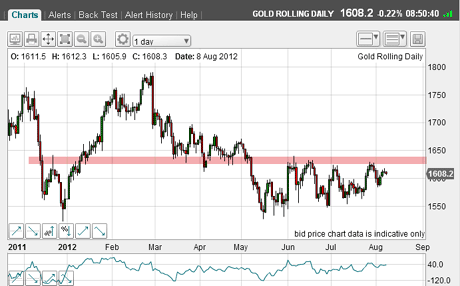
Last week's gold rally to the $1,630 level has taken it to the pink zone. This zone has acted as strong support (March-May) and equally strong resistance (December and since June).
Recent trading has proven it is acting as very strong resistance. I will respect that.
The bottom line is that since the March $1,790 high, the market has been broadly in a down-trend with lower highs and lower lows.
So that is the way I shall continue to trade - until the market tells me to change my stance. If you have any thoughts on gold, leave them below.
If you're a new reader, or need a reminder about some of the methods I refer to in my trades, then do have a look at my introductory videos:
The essentials of tramline trading
An introduction to Elliott wave theory
Advanced trading with Elliott waves
Don't miss my next trading insight. To receive all my spread betting blog posts by email, as soon as I've written them, just sign up here . If you have any queries regarding MoneyWeek Trader, please contact us here.
Get the latest financial news, insights and expert analysis from our award-winning MoneyWeek team, to help you understand what really matters when it comes to your finances.
John is is a British-born lapsed PhD physicist, who previously worked for Nasa on the Mars exploration team. He is a former commodity trading advisor with the US Commodities Futures Trading Commission, and worked in a boutique futures house in California in the 1980s.
He was a partner in one of the first futures newsletter advisory services, based in Washington DC, specialising in pork bellies and currencies. John is primarily a chart-reading trader, having cut his trading teeth in the days before PCs.
As well as his work in the financial world, he has launched, run and sold several 'real' businesses producing 'real' products.
-
 MoneyWeek Talks: The funds to choose in 2026
Podcast Fidelity's Tom Stevenson reveals his top three funds for 2026 for your ISA or self-invested personal pension
-
 Three companies with deep economic moats to buy now
Opinion An economic moat can underpin a company's future returns. Here, Imran Sattar, portfolio manager at Edinburgh Investment Trust, selects three stocks to buy now