This week, I am literally spoiled for choice in my selection of a market to cover where I can illustrate how to use my tramline methods to extract swing trading profits. After all, that is always my intention with these Trader posts.
If you can pick up just one useful idea on how to draw tramlines, or how to use Fibonacci, or how to apply the Elliott wave principle, then my mission is accomplished.
Today, I want to analyse the Hong Kong index (formerly known as the Hang Seng), because the chart patterns are absolutely textbook. In fact, it is an object lesson in how to apply my methods.
Try 6 free issues of MoneyWeek today
Get unparalleled financial insight, analysis and expert opinion you can profit from.

Sign up to Money Morning
Don't miss the latest investment and personal finances news, market analysis, plus money-saving tips with our free twice-daily newsletter
Don't miss the latest investment and personal finances news, market analysis, plus money-saving tips with our free twice-daily newsletter
The rally in the Hong Kong index runs out of steam
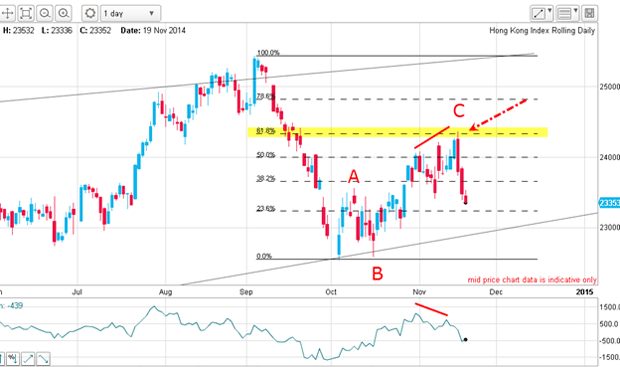
The Hong Kong daily chart is reminiscent of the Nikkei chart I have featured recently. In fact, the Chinese and Japanese are major trading partners and if one catches a cold, the other at least sneezes in sympathy.

But there are some striking differences in the charts. For instance, the October 2014 low is much higher than in the Nikkei relative to the June 2013 and the March 2014 lows. That means I have no obvious tramlines to work with, which I did in the Nikkei but I do have a wedge.
Here is the daily chart going back to 2012:
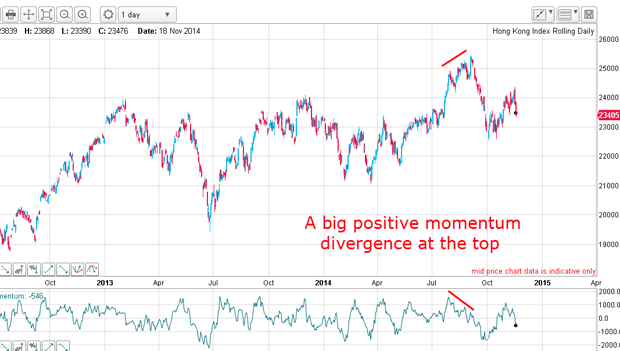
The move into new highs during the summer was accompanied by waning buying power, demonstrated by the very large positive-momentum divergence.
That was a warning the rally was likely running out of steam.
The powerful weapon every trader should use
And now I want to show that wedge:
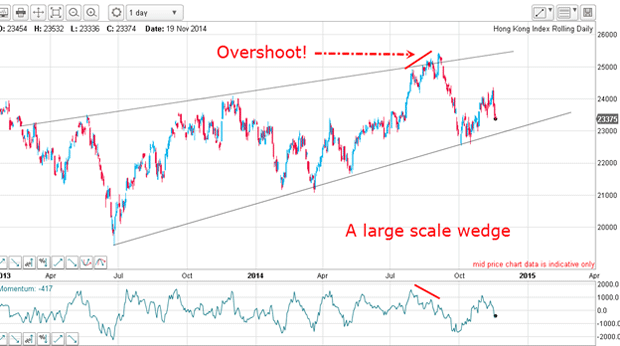
The overshoot of my upper wedge line is another warning to prepare for a swift reversal. That is because an overshoot is a good indication that if the market reverses back below the line (creating the overshoot), the decline is normally a very swift pull-back to the lower line, which is exactly what did occur.
And note the decline into October was stopped at the Fibonacci 62% level:
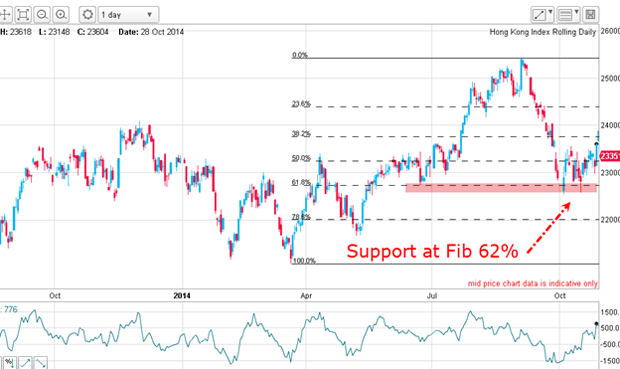
Now just admire the decline it was stopped precisely at the Fibonacci 62% level. This 62% Fibonacci target is a very powerful weapon in your armoury I encourage every trader to make full use of it.
A short-term trader would be taking profits near this level for a tasty 2,000-point profit in two weeks or so.
The ideal place to enter a short trade
Now let's zero in on that top, because it offers yet another clear reversal warning:
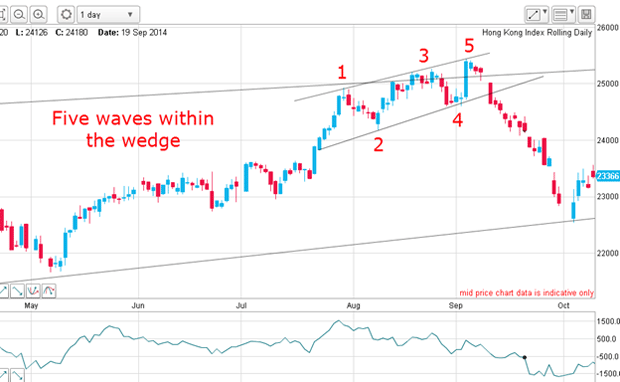
I have a gentle rising wedge at the top, and within it, I can count five clear waves on declining momentum.
This particular five-wave pattern is not an Elliott wave motive pattern, but is a recognised reversal pattern within a wedge when it comes at the end of a strong trend. And it performed that function beautifully!
The negative-momentum divergence, combined with the five mini waves within the top wedge is a very reliable reversal signal. And when the lower wedge line was broken, that was the ideal place to enter a short trade (on a resting stop).
Will we get a textbook trade?
So now we have the predicted sharp decline to the lower wedge line support now for the relief rally. I wonder what form that will take a textbook A-B-C rising to the Fibonacci 62% level perhaps? Am I asking too much?
My prayers were totally answered with an absolute textbook relief A-B-C rally. On Monday, the C wave stopped bang on the Fibonacci 62% level with a negative-momentum divergence thrown in as a bonus. Isn't that pretty?
In addition, the relief rally has formed into another rising wedge with the lower line being broken yesterday. Again, this is a bearish sign. Here it is on the hourly:
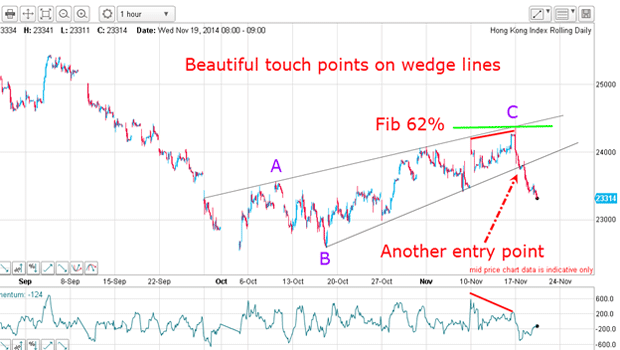
Aggressive traders would be shorting at the Fibonacci 62% level, while more conservative traders would favour the entry at the lower wedge line. And note the negative-momentum divergence at the C wave high another clue the trend was about to reverse back down.
Here's the short term outlook
So what is the outlook in the short term?
If there is a genuine breakout of a rising wedge, the market usually retreats to the origin of the wedge in this case, the B wave low. But there is further downside potential if my Elliott wave labels are correct:
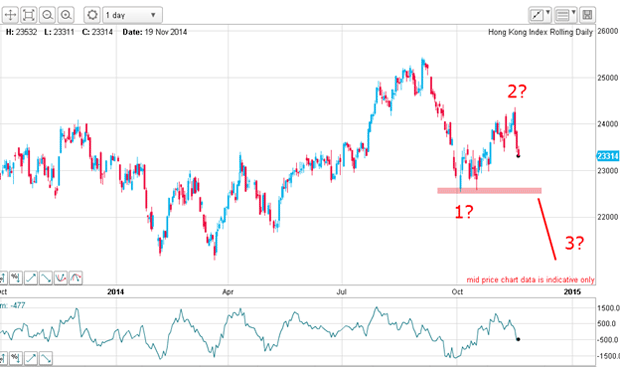
The market may be entering a third wave currently the key is the wave 1 (or B wave) support level. If it can be breached with force, that would indicate we would be in a third wave either wave 3 or a C wave.
In the short term, the market is entering chart support, which could result in a small bounce from current levels. But already, there have been several excellent swing trades available to those who watch this market I suggest you do likewise!