Tesco shares – is it time to buy in now?
Is all the bad news now in Tesco's share price? John C Burford examines the supermarket's share charts to see if it's time to buy.
Get the latest financial news, insights and expert analysis from our award-winning MoneyWeek team, to help you understand what really matters when it comes to your finances.
You are now subscribed
Your newsletter sign-up was successful
Want to add more newsletters?

Twice daily
MoneyWeek
Get the latest financial news, insights and expert analysis from our award-winning MoneyWeek team, to help you understand what really matters when it comes to your finances.

Four times a week
Look After My Bills
Sign up to our free money-saving newsletter, filled with the latest news and expert advice to help you find the best tips and deals for managing your bills. Start saving today!
Yesterday, Tesco released about the worst profit figures I have ever seen for a major consumer company a 92% decline in pre-tax half-year profits. That takes some doing for one of the largest supermarket chains in the world selling food, which is a basic staple!
It is not my remit to discuss the ethical, moral or sociological aspects of such a massive fall from grace of one of the world's leading food retailers although I could!
Today, with sentiment at rock bottom towards the shares, my question is this: with blood in the Tesco aisles, is it time to buy the shares? That would be a mighty contrary stance, given its extreme negative sentiment!
MoneyWeek
Subscribe to MoneyWeek today and get your first six magazine issues absolutely FREE

Sign up to Money Morning
Don't miss the latest investment and personal finances news, market analysis, plus money-saving tips with our free twice-daily newsletter
Don't miss the latest investment and personal finances news, market analysis, plus money-saving tips with our free twice-daily newsletter
If the smart money is selling, should we be buying?
Today, I want to analyse the chart and see if I can make sense of it using my tramline techniques. Remember, I only study selected large caps, because these most often conform to clean tramlines, Elliott waves (EW) and Fibonacci retracements. The smaller caps are too spiky for my taste.
With Tesco shares having been halved in the last year or so, a thoughtful Tesco bear must ask the question: if the smart money is selling, who is doing the buying? And do they know something I do not?
It is well known that Warren Buffet has sold down his massive stake at a considerable loss and naturally, this has attracted many amateur investors into a copycat liquidation, thus damaging sentiment even more.
Interestingly, the short interest is only at around 1% of total shares outstanding, despite the huge declines. To me, this is not high enough for the bulls to dream of a massive short squeeze at some point.
I last covered Tesco on 24 September, and I called the initial profit error' revelation "the shot that was heard around the world". Yesterday's profit figures were even worse than those estimated back then (this is entirely typical when bad news is first released they often get worse as the forensic accountants uncover more horrors).
Here's our Tesco roadmap
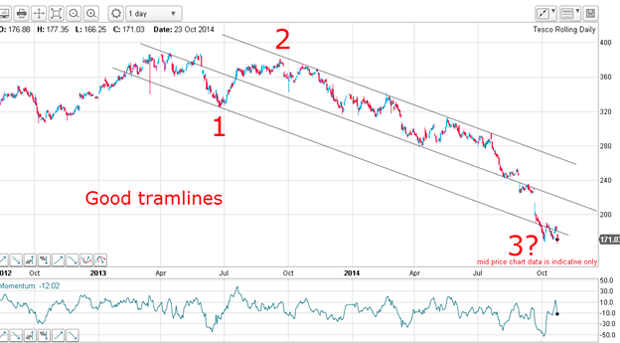
Let's take a look at the daily Tesco chart:

The high was made in June last year at the 380 level. The first significant swoon occurred that month and that is my wave 1. The subsequent rally is my wave 2. From that high, the market embarked on the well-advertised bear trend. This move has all the hallmarks of a third wave. It is long and strong, especially since summer.
And that simple observation confirms that my waves 1 and 2 are correct.
You see, when applying my EW labels, I often start with the third wave, because that is the easiest wave to identify. If it is long and strong, it is probably a third wave of a five-wave pattern. That gives you your roadmap (I have emphasised this point in recent posts).
Note the momentum if the market can stage a rally then a dip, that could set up a huge momentum divergence. Hmm.
Will the market fall even further?
Now that the market has reacted to yesterday's very negative news, the question is this: is all of the bad news now out, and can we buy?
The other major aspect of the chart is my tramline trio. The upper tramline has multiple very accurate touch points, making it a very reliable line of resistance and a solid line from which to draw my other tramlines. This latter point is crucial to my tramline method.
If I have a highly reliable first tramline, I can have confidence in any other tramlines I can draw provided I can find enough good touch points.
And lo and behold, my centre tramline has several touch points, while my lower tramline is fine. I can rely on this trio of tramlines as lines of support/resistance.
But now, with the market toying with the lower tramline, is this the end of wave 3 or will the market fall further?
Of course, if I can identify the wave 3 end, I can anticipate a rally in wave 4. But that would not be the most opportune time to go long! That is because after wave 4 up wave 5 down should come, taking the market to below the low of wave 3. This would allow a much better entry point.
Why Tesco will provide trading opportunities
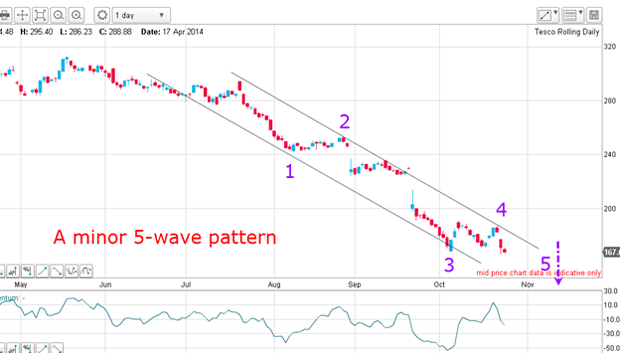
Can the shorter-term chart throw any light?

This is the wave pattern off the July 290 high and the recent steep descent. I have nice tramlines, a long and strong wave 3, a complex wave 4 (this is typical), and now this morning a new low in wave 5.
This pattern is part of the larger picture, of course.
The possibility is that when the above wave 5 terminates, that could also be the end of the large wave 3 in the first chart.
That would set the stage for a decent rally, but not the start of a major one if my wave 5 down appears.
Of course, if the market can rally above the upper tramline and take out the wave 4 high, that would change the picture.
My reading is that most of the damage has already been done and Tesco requires a lot of base-building before it can stage any meaningful rally. It is like a huge oil tanker which takes time to turn around.
But after the confirmed five large waves down, the usual next stage is an A-B-C relief rally. That is not a good time to be making long-term investment decisions, but there will be trading opportunities.
Get the latest financial news, insights and expert analysis from our award-winning MoneyWeek team, to help you understand what really matters when it comes to your finances.
John is is a British-born lapsed PhD physicist, who previously worked for Nasa on the Mars exploration team. He is a former commodity trading advisor with the US Commodities Futures Trading Commission, and worked in a boutique futures house in California in the 1980s.
He was a partner in one of the first futures newsletter advisory services, based in Washington DC, specialising in pork bellies and currencies. John is primarily a chart-reading trader, having cut his trading teeth in the days before PCs.
As well as his work in the financial world, he has launched, run and sold several 'real' businesses producing 'real' products.
-
 Average UK house price reaches £300,000 for first time, Halifax says
While the average house price has topped £300k, regional disparities still remain, Halifax finds.
-
 Barings Emerging Europe trust bounces back from Russia woes
Barings Emerging Europe trust has added the Middle East and Africa to its mandate, delivering a strong recovery, says Max King