Is it time to take profits in the Dow?
Sentiment in the Dow has whipped round to the bear-side. John C Burford inspects the charts to see if it's time to reel in his short trade.
Get the latest financial news, insights and expert analysis from our award-winning MoneyWeek team, to help you understand what really matters when it comes to your finances.
You are now subscribed
Your newsletter sign-up was successful
Want to add more newsletters?

Twice daily
MoneyWeek
Get the latest financial news, insights and expert analysis from our award-winning MoneyWeek team, to help you understand what really matters when it comes to your finances.

Four times a week
Look After My Bills
Sign up to our free money-saving newsletter, filled with the latest news and expert advice to help you find the best tips and deals for managing your bills. Start saving today!
January has been a very long month. We have witnessed a massive about-turn in the equity markets. It's hard to believe that it was only one month ago that the Dow was making its all-time high at 16,600. At that time, it seemed like all the bears had disappeared.
Yes, bullish sentiment was way off the scale at the end of 2013. And most pundits were calling for a more-of-the-same year. But I wasn't.
What a difference a month makes. As I wrote on Monday, fear is now stalking stocks. In 2013, it was greed. But that's really just an extreme version of hope. The 31 December close marked the all-time high. Since then, the Dow has lost 900 pips to last Wednesday's low.
MoneyWeek
Subscribe to MoneyWeek today and get your first six magazine issues absolutely FREE

Sign up to Money Morning
Don't miss the latest investment and personal finances news, market analysis, plus money-saving tips with our free twice-daily newsletter
Don't miss the latest investment and personal finances news, market analysis, plus money-saving tips with our free twice-daily newsletter
We are reading all sorts of reasons' for the decline, from the emerging-market currency routs to the Fed tapering. And it's all very entertaining. But the root cause for the about-turn is the sudden contraction of credit brought about by the reversal of social mood.
The US Fed is leading the charge with its on-going reduction in bond purchases, aka tightening. Junk bond-yield spreads are already widening as credit tightens.
I'm happy to let others fight over what the news means. To me, it's already ancient history. I'm a trader and not overly concerned with the explanations'. I believe they have already been priced in.
So, my job is to find the path of least resistance, because that's when I can take profits out of the market.
Will there be a relief rally?
This is where the Elliott-wave model can be deployed to give clues.

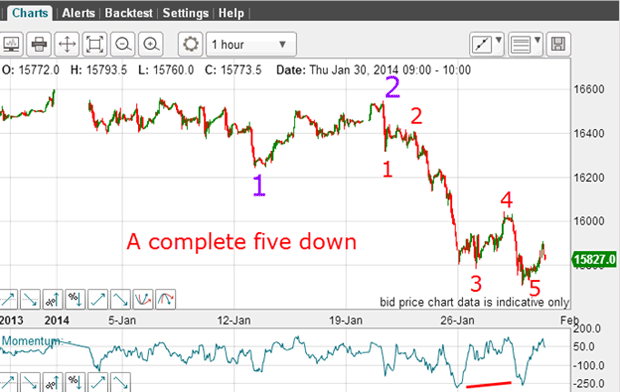
This is the hourly chart showing the entire decline off the 31 December top. I want to focus on the large wave 2 high made on Tuesday 21 January. If my large labels are correct, the decline off this wave 2 high will be a large wave 3. And as we know, third waves are usually long and strong.
The sudden drop off this wave 2 high was the first clue that we are likely in a third wave down. The subsequent cascade decline certainly confirmed this view. But where will we likely see a turn back up?
Panic selling often leads to overshoots
Now I can expect an A-B-C rally. That is one possible scenario.
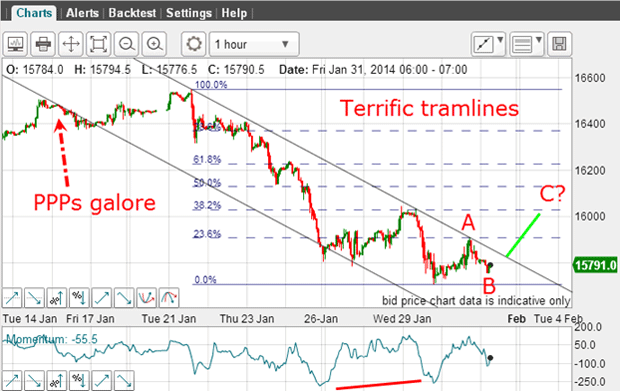
The market has already made a small move up off the wave 5 low, which could be part of my A wave. So now I can apply my Fibonacci levels to give me an idea for the likely wave pattern:

The entire move down off the wave 2 high is beautifully contained within the trading channel between my tramlines. The upper line has four accurate touch points and the lower line sports those lovely PPPs (prior pivot points).
The touch points on the lower line are not accurate. But that's OK because they appear at the end of an especially fierce period of panic selling. I often see similar overshoots under these conditions.
I have labelled the first move up as wave A and the current dip as wave B. Under this scenario the market should rally in a wave C and this rally would carry the market above my upper tramline in a tramline break. This would be a very significant event.
If this occurs, there is a possibility that the C wave could carry further than most expect. After all, I have noted previously that the Dow is notorious for deep upward retracements. Hmm.
The bigger picture

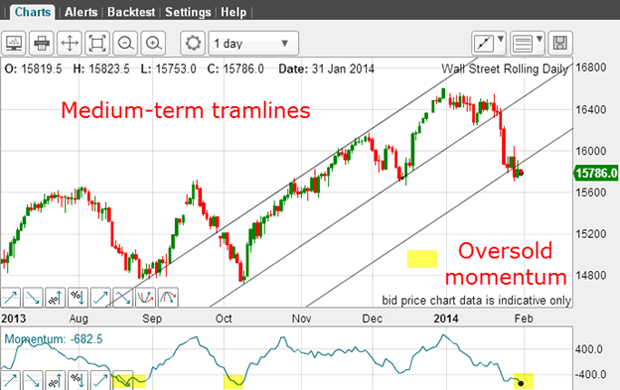
This is the daily chart showing my medium-term tramlines with the market having declined to the area of the lowest line. Since this line represents support, it is no surprise that the market has been testing this area.
But the momentum reading is indicating an oversold condition. And when momentum reached this level on the past two occasions, vigorous rallies ensued.
The alternative scenario - still very much on the table is for a continuation of the decline away from the lowest tramline. This would mean that the five-wave pattern on the hourly chart had not yet completed and a new wave 5 was being put in place.
The key area to watch is the upper tramline shown on my second chart. I'll be watching for signs of an A-B-C, which would likely be confirmed by a tramline break.
How far will the fifth wave carry?
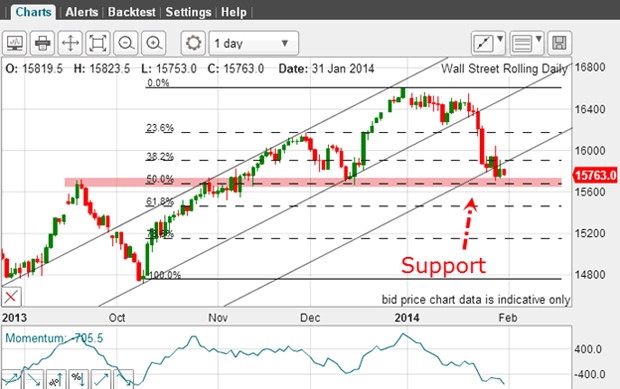
One other area to watch is this support area:

The pink zone is the area of support from the September high, the December low, the Fibonacci 50% retrace and the lowest tramline. This is a very powerful support area. And if it gives way in a fifth wave extension, the die will be cast.
Because this is a solid support area, a great short-term profit of over 600 pips on my short trade is available.
Get the latest financial news, insights and expert analysis from our award-winning MoneyWeek team, to help you understand what really matters when it comes to your finances.
John is is a British-born lapsed PhD physicist, who previously worked for Nasa on the Mars exploration team. He is a former commodity trading advisor with the US Commodities Futures Trading Commission, and worked in a boutique futures house in California in the 1980s.
He was a partner in one of the first futures newsletter advisory services, based in Washington DC, specialising in pork bellies and currencies. John is primarily a chart-reading trader, having cut his trading teeth in the days before PCs.
As well as his work in the financial world, he has launched, run and sold several 'real' businesses producing 'real' products.
-
 Should you buy an active ETF?
ETFs are often mischaracterised as passive products, but they can be a convenient way to add active management to your portfolio
-
 Power up your pension before 5 April – easy ways to save before the tax year end
With the end of the tax year looming, pension savers currently have a window to review and maximise what’s going into their retirement funds – we look at how