Fear is stalking the Dow Jones index
The bulls of the Dow paid a high price for their complacency, says John C Burford. And more punishment may yet be on the way.
Get the latest financial news, insights and expert analysis from our award-winning MoneyWeek team, to help you understand what really matters when it comes to your finances.
You are now subscribed
Your newsletter sign-up was successful
Want to add more newsletters?

Twice daily
MoneyWeek
Get the latest financial news, insights and expert analysis from our award-winning MoneyWeek team, to help you understand what really matters when it comes to your finances.

Four times a week
Look After My Bills
Sign up to our free money-saving newsletter, filled with the latest news and expert advice to help you find the best tips and deals for managing your bills. Start saving today!
A lot has happened in the stock markets since I wrote Friday's post. Later that day, the market entered free-fall territory. The Dow had closed off 333 pips by the time the session ended.
I would say this action has confirmed that the gap I identified on 2 January is a breakaway gap.
Over the weekend, the pundits were out in force explaining' the collapse. But while their entrails examination was very entertaining, it actually has zero forecasting value. Where were the experts' when the Dow was making its all-time high a few days ago? That was when we could have used their expert analysis.
MoneyWeek
Subscribe to MoneyWeek today and get your first six magazine issues absolutely FREE

Sign up to Money Morning
Don't miss the latest investment and personal finances news, market analysis, plus money-saving tips with our free twice-daily newsletter
Don't miss the latest investment and personal finances news, market analysis, plus money-saving tips with our free twice-daily newsletter
So that's why serious traders concentrate on their charts and analytical methods it lets us position well in advance of any large move.
The power of tramline analysis
So why did the Dow suddenly turn tail mid-week? And why did this not happen at some previous point? These pundits have no explanation. It all seems so obvious to them - after the event, of course.
But I do have an explanation. And it has nothing to do with the news.
The market turned because my Elliott wave labels showed a completed rally and the Dow had made a precise hit on my long-term tramline I showed that chart on Friday. I am posting a copy of it just above my screen as a reminder of the power of tramline analysis. It is sure to become a classic.
One other factor is behind the big falls last week the sentiment picture. Bullish complacency had reached epic proportions. In fact, the Vix (the 'fear index') was near record lows. During such conditions, I always ask: where is the new wave of bulls coming from to drive the market ever higher?
One usual source of buying is from the bears who are being squeezed. But they appeared to be few in number, especially in the Nasdaq. That gave me the idea that the decline should be very sharp and deep. Last week's action certainly confirmed this thought.
Is the Dow's third wave complete?
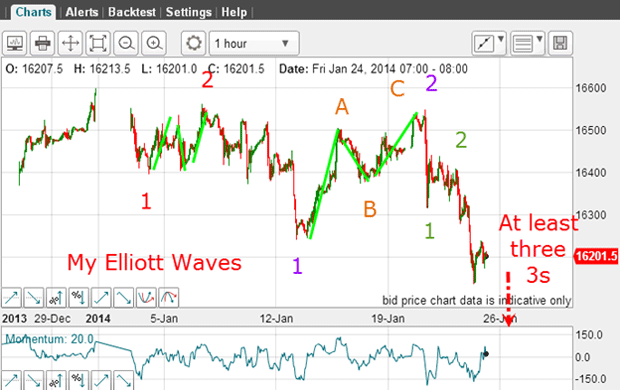
On Friday, I believed the Dow was in an epic third wave down of various degrees of trend. This was my chart when the Dow was trading at the 16,200 level:

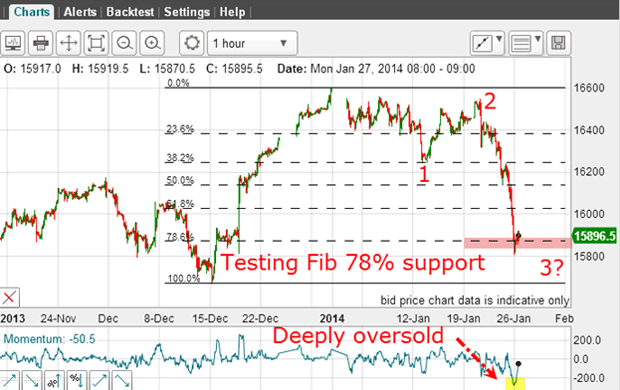
And this is the chart this morning:

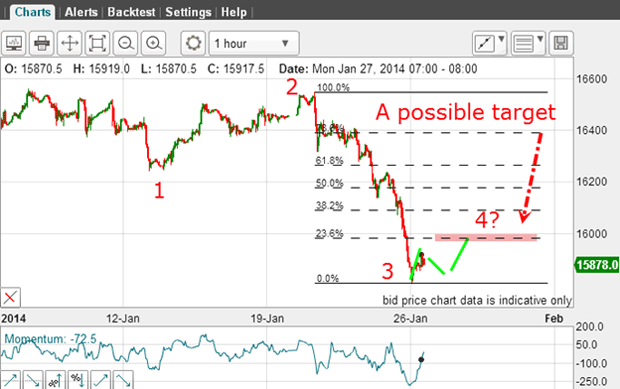
Overnight, the market dropped to the 15,850 level a full 350 pips below Friday morning's level shown in the first chart. But in the process it has become deeply over-sold in the near-term. And that means it is due a bounce. This current bounce could be wave 4 - if wave 3 has completed.
But the move down is enormous and backs up my contention that it is a third wave of several degrees of trend. The A-B-C interpretation carries much less weight now given the steep decline.
This third wave is certainly long and strong, but it may not have finished its work. Still, it has fallen to the important Fibonacci 78% retrace of the last major wave up, and this level is usually good support. The odds of wave 3 having now completed is high, and wave 4 up is very likely in progress this morning.
Naturally, short-term traders could take their well-earned profits of at least 600 pips this morning.
Forecasting the extent and form of wave 4

Wave 4 will be a relief counter-trend rally and could be in the usual A-B-C form. And because wave 3 was so fierce, wave 4 could be short. It would then only reach the Fibonacci 23% level before turning down again in a fifth wave. That is my best guess scenario. If this occurs, then I expect wave 5 to be deep.
Whatever shape wave 4 turns out to be, the market has been hit hard and the bulls will need time to recover. But will the market give them that time, or will there be another sharp leg down very soon?
It appears I am well on my way to my first major target at the 15,000 level.
Get the latest financial news, insights and expert analysis from our award-winning MoneyWeek team, to help you understand what really matters when it comes to your finances.
John is is a British-born lapsed PhD physicist, who previously worked for Nasa on the Mars exploration team. He is a former commodity trading advisor with the US Commodities Futures Trading Commission, and worked in a boutique futures house in California in the 1980s.
He was a partner in one of the first futures newsletter advisory services, based in Washington DC, specialising in pork bellies and currencies. John is primarily a chart-reading trader, having cut his trading teeth in the days before PCs.
As well as his work in the financial world, he has launched, run and sold several 'real' businesses producing 'real' products.
-
 MoneyWeek Talks: The funds to choose in 2026
Podcast Fidelity's Tom Stevenson reveals his top three funds for 2026 for your ISA or self-invested personal pension
-
 Three companies with deep economic moats to buy now
Opinion An economic moat can underpin a company's future returns. Here, Imran Sattar, portfolio manager at Edinburgh Investment Trust, selects three stocks to buy now