A possible turning point in the FTSE 100
John C Burford uses his tramline trading technique to sport a possible turning point in the FTSE100 index.
Get the latest financial news, insights and expert analysis from our award-winning MoneyWeek team, to help you understand what really matters when it comes to your finances.
You are now subscribed
Your newsletter sign-up was successful
Want to add more newsletters?

Twice daily
MoneyWeek
Get the latest financial news, insights and expert analysis from our award-winning MoneyWeek team, to help you understand what really matters when it comes to your finances.

Four times a week
Look After My Bills
Sign up to our free money-saving newsletter, filled with the latest news and expert advice to help you find the best tips and deals for managing your bills. Start saving today!
Like anything else (and especially in the field of trading), being proficient at tramline trading takes practice and the more you do, the better your performance will become.
Successful tramline trading is a mix of art and science.
For one thing, why is it that market highs and lows often can be connected by straight lines?
MoneyWeek
Subscribe to MoneyWeek today and get your first six magazine issues absolutely FREE

Sign up to Money Morning
Don't miss the latest investment and personal finances news, market analysis, plus money-saving tips with our free twice-daily newsletter
Don't miss the latest investment and personal finances news, market analysis, plus money-saving tips with our free twice-daily newsletter
I do not have an answer to that I simply accept that time after time, charts throw up these lines. Sometimes, these lines have a small slope (or are horizontal), and sometimes they have a high slope. And they occur in all time frames.
If you are good at looking at a chart and spotting these patterns, you have an advantage!
As I have said many times before, markets do not adhere to my tramlines for ever. They eventually fail. Then I go looking for another set, which I may or may not find.
One other feature of tramlines is that you can have several pairs independently working at the same time on the same chart.
The FTSE 100 hits resistance
I recently gave an analysis of the FTSE 100 market using my tramline concepts.
Very soon after posting that, I found I had something else to draw your attention to.
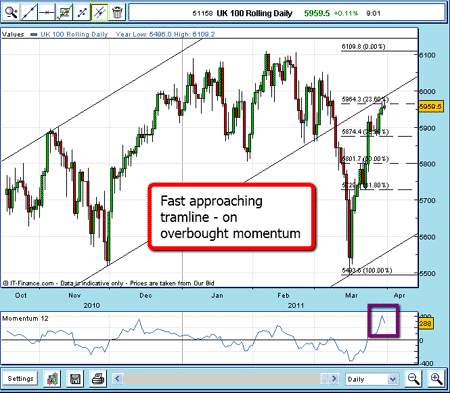
Recall on the daily chart, the FTSE is trading between my up-sloping pair of tramlines, and is in the upper half of the channel.
Here is the current daily chart showing the market, having dipped in mid-March, is now rallying to a very significant chart point.

(Click on the chart for a larger version)
Just above is the central tramline I drew weeks and months ago.
But also, I have drawn my Fibonacci tool over the pivot high at 6,109 and the pivot low at 5,493.
I always draw in my Fibonacci levels when in a retracement period, as we are now. This gives me the likely stopping points for the rally.
So right above we have two strong potential resistance points. It would take a lot of buying energy to overcome this resistance, especially now that momentum readings are showing buying is drying up.
So the odds favour at least a temporary top around here.
Zoming in to spot a potential trade
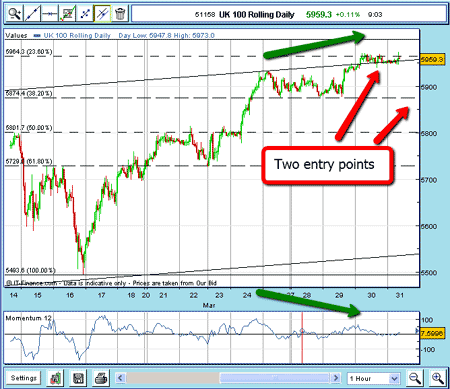
Let's see if the hourly chart can throw any light on whether we have a possible trade (assuming we have no position):

(Click on the chart for a larger version)
On the hourly, we see a potential negative divergence with momentum. This shows that on the short-term also, the rally is losing momentum.
For traders who are bearish, this is great evidence to support their short sales.
For traders who are long, this would be a great place to either take profits on part or all of their positions.
For more cautious traders, if the market fails to break the previous chart support at 5870, that would confirm the top, in all likelihood.
By trading in this fashion, you can keep your losses in check, since you can place your protective stops just above the tramline/Fibonacci level.
Being stopped out would mean that the market is not ready to turn. But at least, you have made a logical trade based on sound principles.
That is all you can expect from trading. Keep doing that, and success may well be yours.
By the time you read this, the market may have moved significantly I promise to follow up in a few days, as this is an exciting time in the FTSE.
NB: Don't miss my next bit of trading advice. To receive all my spread betting blog posts by email, as soon as I've written them, just sign up here .
Get the latest financial news, insights and expert analysis from our award-winning MoneyWeek team, to help you understand what really matters when it comes to your finances.
John is is a British-born lapsed PhD physicist, who previously worked for Nasa on the Mars exploration team. He is a former commodity trading advisor with the US Commodities Futures Trading Commission, and worked in a boutique futures house in California in the 1980s.
He was a partner in one of the first futures newsletter advisory services, based in Washington DC, specialising in pork bellies and currencies. John is primarily a chart-reading trader, having cut his trading teeth in the days before PCs.
As well as his work in the financial world, he has launched, run and sold several 'real' businesses producing 'real' products.
-
 What is a care fees annuity and how much does it cost?
How we will be cared for in our later years – and how much we are willing to pay for it – are conversations best had as early as possible. One option to cover the cost is a care fees annuity. We look at the pros and cons.
-
 How to navigate the inheritance tax paperwork maze in nine clear steps
Families who cope best with inheritance tax (IHT) paperwork are those who plan ahead, say experts. We look at all documents you need to gather, regardless of whether you have an IHT bill to pay.