A live trade in the FTSE 100
John C Burford gives a blow by blow account of a live spread betting trade in the FTSE 100.
Get the latest financial news, insights and expert analysis from our award-winning MoneyWeek team, to help you understand what really matters when it comes to your finances.
You are now subscribed
Your newsletter sign-up was successful
Want to add more newsletters?

Twice daily
MoneyWeek
Get the latest financial news, insights and expert analysis from our award-winning MoneyWeek team, to help you understand what really matters when it comes to your finances.

Four times a week
Look After My Bills
Sign up to our free money-saving newsletter, filled with the latest news and expert advice to help you find the best tips and deals for managing your bills. Start saving today!
Before we start, I'd just like to say I was delighted to see so many faces at my seminar at the Traders Expo in London on Saturday. I talked about my Tramline Trading methods and it was great to get to talk to some of you in person. If you made it, I hope you enjoyed it.
Anyway, I left the FTSE 100 last time showing the wonderful tramlines displayed on the daily chart. I mentioned in that blog that I would follow up this trade as I believed that the times were a'changing in this market.
To give you a better understanding of how I plan and execute a spread bet, I'll give a moment-by-moment log of my operations and thinking behind this particular FTSE trade. The trade remains open at the time of writing (12 April), so I will continue to follow it in future blogs until I close it out.
MoneyWeek
Subscribe to MoneyWeek today and get your first six magazine issues absolutely FREE

Sign up to Money Morning
Don't miss the latest investment and personal finances news, market analysis, plus money-saving tips with our free twice-daily newsletter
Don't miss the latest investment and personal finances news, market analysis, plus money-saving tips with our free twice-daily newsletter
Obviously, you won't be getting this email as I write it but I hope that by writing in real time, with the charts to match, it will give you some idea of my thinking (and emotions!) during one of my typical trades.
Hunting down a promising FTSE 100 trade
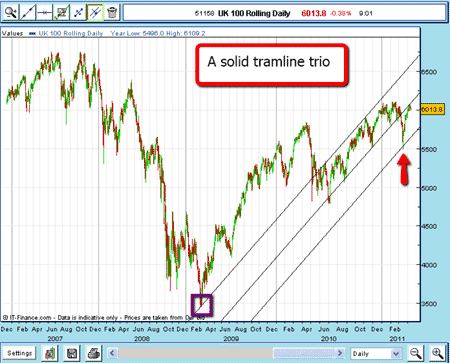
Here goes this is the daily chart going back to the deep lows of early 2009:

(Click on the chart for a larger version)
It shows the terrific anchor point at the spike low in March 2009 for my upper tramline. This line cuts right across all of the significant highs made since May of last year.
My second (centre) tramline passes through the minor lows since the summer of last year, while my equidistant third tramline (the lowest one) just about intersects the spike low of last March.
So far, so good.
Let's now take a closer look at recent trading.
The FTSE rally is running out of steam
The rally since last summer has been very strong by all measures, but it has failed to reach my upper tramline. This, to me, is a warning. It shows the market may well be running out of steam. Then we had that big break in February of over 600 points. That must have given the bulls pause to reflect.
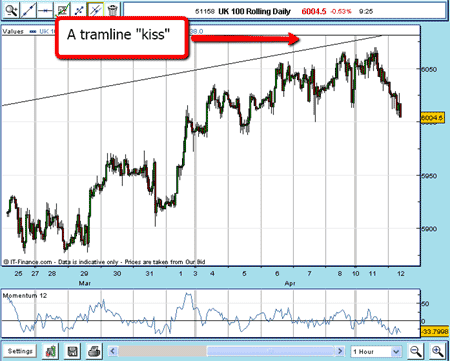
And since then, the rally has carried right up to the underside of my centre tramline. Here it is in close-up:

(Click on the chart for a larger version)
Note how the market is in the process of making a 'kiss' and is backing off.
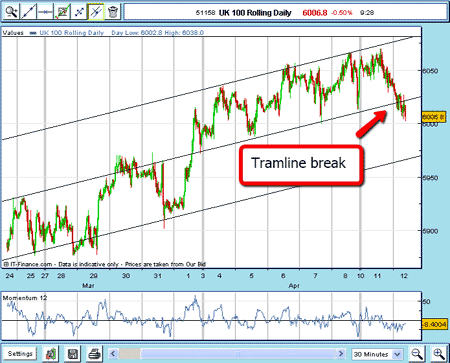
Let's focus in on a 30-min chart.

(Click on the chart for a larger version)
I have tidied up my upper tramline to catch the tops and have drawn my centre tramline across the minor lows. My third tramline I have drawn equidistant and parallel and it passes through the late March lows. I will use this set-up for my trading.
Making the trade
April 12th, 8:00am: I enter an order to sell FTSE at 6016 on a stop, which is quickly filled. I enter a protective stop at 6030 for a 14 pip risk (in other words, if the FTSE rises to 6,030, my short trade will be stopped out). This is within my 3% rule.
I would like to see the 5,990 level reached today, since that is a minor low made on 5 April . I feel that if this level can be breached, that should induce further selling. But my next real target is my lowest tramline at the 5,970 area.
10.45am: The market has fallen to my 5,990 level and has made a small bounce. I will need to see it down closer to 5,970 before I can move my stop to break-even. But so far, so good.
3:15pm: I'm back in the office, and I see that my first target at 5,970 has been hit. Great. Now I am moving my protective stop to break-even at 6,016. I note also that other key markets I watch, such as copper, gold, silver and crude are all well down on the day.
That is in total accordance with my belief that when the markets turn, they will turn all together (more or less). But the key market for me is the T-Bond market and that is rallying today very strongly. This means to me that risk is being taken off the table and there is a flight to safety going on.
I shall monitor the market now as my next target is 5,930, which is a Fibonacci 23.6% retrace of the entire March/April rally. Look out for my next blog where I will develop this trade, which is looking promising.
NB: Don't miss my next bit of trading advice. To receive all my spread betting blog posts by email, as soon as I've written them, just sign up here.
Get the latest financial news, insights and expert analysis from our award-winning MoneyWeek team, to help you understand what really matters when it comes to your finances.
John is is a British-born lapsed PhD physicist, who previously worked for Nasa on the Mars exploration team. He is a former commodity trading advisor with the US Commodities Futures Trading Commission, and worked in a boutique futures house in California in the 1980s.
He was a partner in one of the first futures newsletter advisory services, based in Washington DC, specialising in pork bellies and currencies. John is primarily a chart-reading trader, having cut his trading teeth in the days before PCs.
As well as his work in the financial world, he has launched, run and sold several 'real' businesses producing 'real' products.
-
 Average UK house price reaches £300,000 for first time, Halifax says
While the average house price has topped £300k, regional disparities still remain, Halifax finds.
-
 Barings Emerging Europe trust bounces back from Russia woes
Barings Emerging Europe trust has added the Middle East and Africa to its mandate, delivering a strong recovery, says Max King