A lesson in Elliott wave analysis from the Aussie dollar
Elliott wave analysis can indicate with high probability the direction of the next market move. Here's an example trading the Aussie dollar.
Get the latest financial news, insights and expert analysis from our award-winning MoneyWeek team, to help you understand what really matters when it comes to your finances.
You are now subscribed
Your newsletter sign-up was successful
Want to add more newsletters?

Twice daily
MoneyWeek
Get the latest financial news, insights and expert analysis from our award-winning MoneyWeek team, to help you understand what really matters when it comes to your finances.

Four times a week
Look After My Bills
Sign up to our free money-saving newsletter, filled with the latest news and expert advice to help you find the best tips and deals for managing your bills. Start saving today!
I use Elliott wave principles and Fibonacci retracement analysis extensively in my trading, across many time-frames.
Why do I use them? I have found that the Elliott wave principle is one of the very few analytical methods that can indicate, with high probability, the direction of the next market move within a chosen time-frame.
Please don't get the impression that there is anything like 100% certainty here. Markets are inherently probabilistic. If you need evidence, just review the forecasts of most 'experts', from chief economists with major trading banks, to market commentators on blogs. My colleague, David Stevenson, recently put up a wonderful chart showing just how pitiful their forecasting record really is.
MoneyWeek
Subscribe to MoneyWeek today and get your first six magazine issues absolutely FREE

Sign up to Money Morning
Don't miss the latest investment and personal finances news, market analysis, plus money-saving tips with our free twice-daily newsletter
Don't miss the latest investment and personal finances news, market analysis, plus money-saving tips with our free twice-daily newsletter
With that caveat in mind, recent charts of the Aussie dollar's performance against its US counterpart show just how effective Elliott wave analysis can be.
Trading the Australian dollar
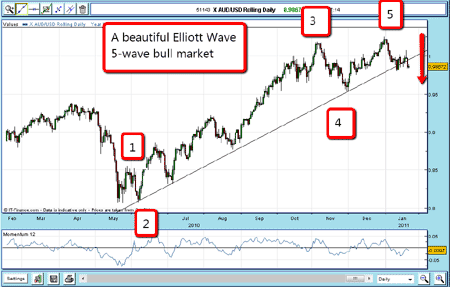
The Australian dollar is a major currency with high trading volumes, so it passes my litmus test for trading. Have a glance at the chart of the ASD/USD, going back to early last year (below).

(Click on the chart for a larger version)
The Australian dollar had been in a bull market since November 2008, where it made a low near $0.60. Today, it is trading at around parity. That's quite a move and understandable too, considering Australia's booming commodity trade with the world (and the US dollar's weakness).
The market made a low in May at around $0.80 last year, and has been climbing ever since.
Note the big summer waves on its march to the 31 December high in the $1.025 area. I have labelled waves 1, 2, 3, 4 and 5 as my best fit.
Also, note the solid uptrend line, which passes right through the four major lows in 2010.
That is another feature of many trends. In a bull market, the lows can often be connected by a straight line we call the 'uptrend line'. It also works for bear markets, but in reverse. These trend lines act as support in bull markets, and resistance in bear markets. Breaking a well-established uptrend line is often a reliable indication of a change of trend.
The trend changes
Now see what happened after wave 5 was put in. The market dropped. One of Elliott's rules is that market moves are complete when there is a five-wave pattern. In other words, the fifth wave is always an ending wave. The trend has now changed to down.
So with the fifth wave complete, I can expect the market to head lower. With this knowledge, a short trade might be worth lining up. But how low is the market likely to fall from wave 5? Another of Elliott's rules states that five-wave moves are always in the direction of the larger trend in this case, up. Retracements of five-wave moves are almost always three-wave affairs (some can be very complex, though).
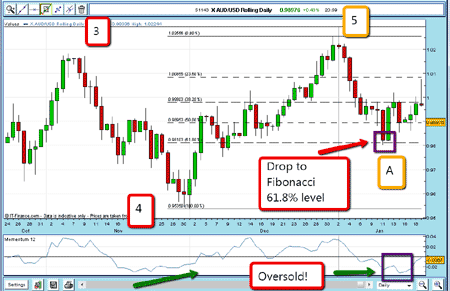
So let's apply the trusty Fibonacci tool to the previous wave in this case, using the pivot points at waves 4 and 5.

(Click on the chart for a larger version)
Typical retracements stop at the 50% or the 61.8% levels. So, in early January, the market was heading either to the 50% level or the 61.8% level, in all probability. That was useful knowledge! A short trade near the $1.0225 high could have produced at least a 300 pip gain definitely worth going for.
Another possibility though is to wait to go long (as in this case it means trading with the main trend, which is always good). One option would be to enter buy orders at the 50% level ($0.9895) using a 3% stop of, say, 40 pips. A trader doing that would have been stopped out on 11 January for a loss.
However, it would still have been worth looking out for another shot at the next Fibonacci level, which was the 61.8% area. In this case, a buy order at the 61.8% level at $0.9810, using the same risk of 40 pips, would have delivered.
The market started to rally, giving an opportunity for our trader to raise his stop to break-even, following the break-even rule. At the 61.8% level, as you can see on the chart above, the momentum reading is also oversold. This would add to our trader's conviction that the bottom has been hit. The oversold condition is being corrected by rallying.
Now, what can be expected next from the market? I shall cover that in my next post.
Meanwhile, why not start using your Fibonacci tool on your spread-betting platform and applying it to some distinct waves? I'm confident you will find more than a few times where the market retraces to a Fibonacci level and then rebounds.
Usually, there will be a good bounce, giving you time to move your stop to the break-even level, giving you a free ride, even if the market does move back to your entry. This is low-risk trading a trader's dream!
NB: Don't miss my next bit of trading advice. To receive all my spread betting blog posts by email, as soon as I've written them, just sign up here .
Get the latest financial news, insights and expert analysis from our award-winning MoneyWeek team, to help you understand what really matters when it comes to your finances.
John is is a British-born lapsed PhD physicist, who previously worked for Nasa on the Mars exploration team. He is a former commodity trading advisor with the US Commodities Futures Trading Commission, and worked in a boutique futures house in California in the 1980s.
He was a partner in one of the first futures newsletter advisory services, based in Washington DC, specialising in pork bellies and currencies. John is primarily a chart-reading trader, having cut his trading teeth in the days before PCs.
As well as his work in the financial world, he has launched, run and sold several 'real' businesses producing 'real' products.
-
 Should you buy an active ETF?
ETFs are often mischaracterised as passive products, but they can be a convenient way to add active management to your portfolio
-
 Power up your pension before 5 April – easy ways to save before the tax year end
With the end of the tax year looming, pension savers currently have a window to review and maximise what’s going into their retirement funds – we look at how