Trading the tramlines in the S&P 500
Here's a trade I made on the S%P 500, using tramlines to help me time things.
Get the latest financial news, insights and expert analysis from our award-winning MoneyWeek team, to help you understand what really matters when it comes to your finances.
You are now subscribed
Your newsletter sign-up was successful
Want to add more newsletters?

Twice daily
MoneyWeek
Get the latest financial news, insights and expert analysis from our award-winning MoneyWeek team, to help you understand what really matters when it comes to your finances.

Four times a week
Look After My Bills
Sign up to our free money-saving newsletter, filled with the latest news and expert advice to help you find the best tips and deals for managing your bills. Start saving today!
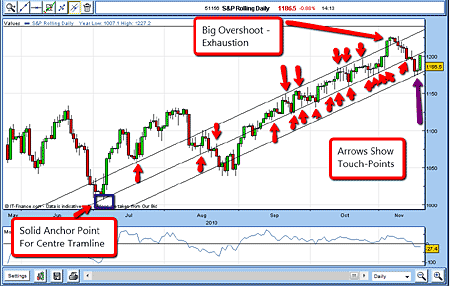
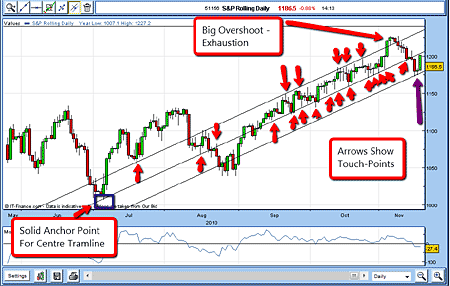
The US stock indexes have been trading in a very orderly uptrend since the August lows. In fact, volatility has been very subdued, as the S&P 500 has climbed from 1,040 level to the recent high of 1,225. That's a gain of almost 18%.
Before August, there were very wide swings, with the VIX readings much higher (VIX is a well-known measure of the volatility of the S&P). But following the 1,040 low, the market has been remarkably subdued, as you can see on the chart below.
(If you wish to follow the VIX by the way and if you are trading the US indices, you really should you can find it at Yahoo Finance or many other financial sites)
MoneyWeek
Subscribe to MoneyWeek today and get your first six magazine issues absolutely FREE

Sign up to Money Morning
Don't miss the latest investment and personal finances news, market analysis, plus money-saving tips with our free twice-daily newsletter
Don't miss the latest investment and personal finances news, market analysis, plus money-saving tips with our free twice-daily newsletter
So that was quite a transformation we saw in August. What was it that changed the character of the market?
The August turning point the Fed strikes back
In the early summer, US economic data was uniformly grim, at a time when the market was expecting some relief from the devastation of the credit crunch of 2007-2009. After all, the S&P plunged from its all-time high of 1,575 in October 2007 to a low of 666 (is this number significant?) in March 2009. The Fed had launched the first wave of quantitative easing (QE) but this had been considered a failure, given that the aim was to bolster confidence and boost asset prices.

But in August, word began to spread that the Fed would launch another round of QE. The market rallied against this backdrop, as it became convinced that this time, it would work.
Also, US economic data issued between September and November turned out to be less bad than in the previous period.
So far, so good. But the market became too bullish. Measures of bullish enthusiasm hit extreme levels by early November. In a previous post, I showed you how the Daily Sentiment Index (DSI available from trade-futures.com) measures the percentage of S&P traders who are bullish or bearish. This measure hit figures of more than 95% bullish at times that's historically extremely high. History shows that when traders are so convinced of their bullish stance, the market soon heads down.
Drawing my tramlines
By mid-October, I had enough points (lows and highs) to enable me to draw a straight line through a large number of low points. This is the centre tramline in the chart below (which I've repeated from above for convenience).

Using my parallel line tool on my trading platform, I then drew my upper tramline through the tops. Note that my centre tramline also passes through a very significant low made as long ago as July. I find that when I have a significant anchor point from previous trading, the tramline is a solid one.
Trading from early September to early November was largely confined between these two tramlines. Of course, some trading pokes through the tramlines, but as a best fit, my lines are reliable as lines of support and resistance.
Having created my two tramlines, I could then draw my third tramline equidistant from my centre line.
Now how did I trade using this information?
The trades

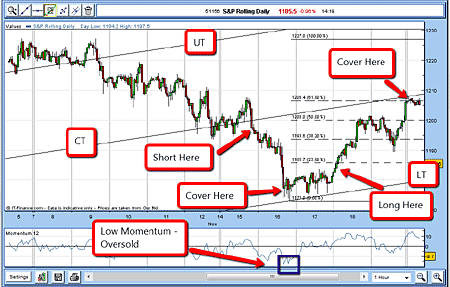
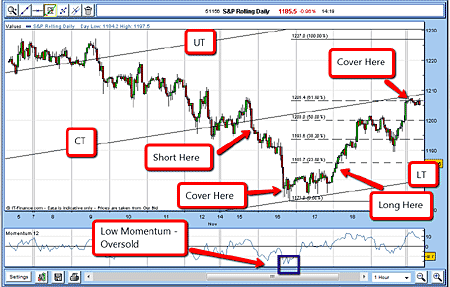
UT = upper tramlineCT = centre tramlineLT = lower tramline
On 4 November, the market spiked right up through the UT and stayed there for a couple of days (where the chart above begins). But because I felt the market was near exhaustion (remember that record-high DSI?), I expected the market to trade back inside UT and CT, and so it did. From 9-15 November, the market dropped to the CT.
Because the market had exhausted itself above my upper tramline, I felt it would soon trade below my centre tramline too. So I decided I would wait with a sell order, expecting the market to drop to the LT in short order. On 6 November, I entered a resting sell order at 1,195. I decided to risk ten 'handles' (100 pips). And since my account had now grown, I could risk betting £2 a point (£200) without breaching my all-important 3% rule.
16 Nov sell S&P rolling @ 1,195.
Protective stop @ 1,226.
Risk £200 (3%)
And sure enough, the market fell right through to the LT at the end of the day, where I was waiting with a buy order to cover at 1,176.
16 Nov cover @ 1,176.
Profit 190 pips (£380) on risk of £200
What now?

I noted the market had retreated to my LT on very low momentum (see the chart, repeated above), so I started to look for a long trade. The very next day was a consolidation day, and I felt the day after would give me clues as to direction. It conceivably could carry on falling. I didn't want to be long if that scenario panned out.
But when the market rallied above the 1,184 level (the previous day's high), I had my resting buy order ready with the same level of risk (marked 'Long Here' on the chart above):
18 Nov long S&P rolling @ 1,184.
Protective stop @ 1,174.
Risk £200 (3%)
With the low of 1,172 in, I could then bring out my Fibonacci tool and apply it, using the 1,172 as the low anchor point and the recent high of 1,227 as the high anchor point. I felt that at least a 50% correction (to the 1,200 level) was likely perhaps even more.
As the market closed firm on the 18th I moved my protective stop to my break-even point using my break even rule. I now had a risk-free trade working.
On the 19th the market dipped and then rallied towards the Fibonacci 61.8% retrace level, which coincided with the underside of my CT.
How convenient I now had the perfect point to take profits. Entering a resting sell order at 1,206, I was taken out early on Monday 22 November.
22 Nov sold S&P rolling @ 1,206.
Profit 220 pips (£440)
Risk £200
On that little ride along my tramlines, I had made a tidy profit of £820 on two £2 bets, simply short-term trading the S&P in the space of a week.
Get the latest financial news, insights and expert analysis from our award-winning MoneyWeek team, to help you understand what really matters when it comes to your finances.
John is is a British-born lapsed PhD physicist, who previously worked for Nasa on the Mars exploration team. He is a former commodity trading advisor with the US Commodities Futures Trading Commission, and worked in a boutique futures house in California in the 1980s.
He was a partner in one of the first futures newsletter advisory services, based in Washington DC, specialising in pork bellies and currencies. John is primarily a chart-reading trader, having cut his trading teeth in the days before PCs.
As well as his work in the financial world, he has launched, run and sold several 'real' businesses producing 'real' products.
-
 ISA fund and trust picks for every type of investor – which could work for you?
Whether you’re an ISA investor seeking reliable returns, looking to add a bit more risk to your portfolio or are new to investing, MoneyWeek asked the experts for funds and investment trusts you could consider in 2026
-
 The most popular fund sectors of 2025 as investor outflows continue
It was another difficult year for fund inflows but there are signs that investors are returning to the financial markets