Silver swings wildly - yet follows some definite rules
Silver's notorious volatility has led many novice traders and spread betters to believe that its market is irrational and follows no discernable pattern. But nothing could be further from the truth, says John C Burford.
Get the latest financial news, insights and expert analysis from our award-winning MoneyWeek team, to help you understand what really matters when it comes to your finances.
You are now subscribed
Your newsletter sign-up was successful
Want to add more newsletters?

Twice daily
MoneyWeek
Get the latest financial news, insights and expert analysis from our award-winning MoneyWeek team, to help you understand what really matters when it comes to your finances.

Four times a week
Look After My Bills
Sign up to our free money-saving newsletter, filled with the latest news and expert advice to help you find the best tips and deals for managing your bills. Start saving today!
In the past few weeks especially, the silver market has captured the public's imagination. Almost every day, silver prices have been making new highs and making bold headlines. Amazingly, gold is being left in the dust I am tempted to say it has become the rich man's silver!
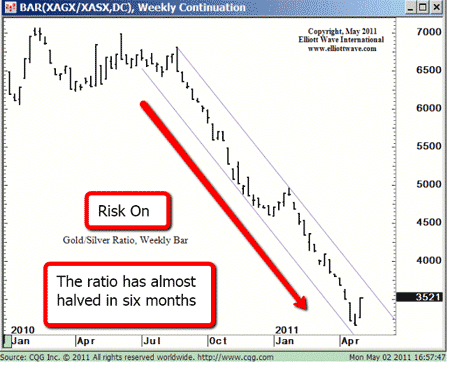
For an idea of how much silver has been out-performing gold, here is a very instructive chart of the gold/silver ratio a key indicator of investors' appetite for risky assets of all kinds. For many reasons, silver is considered a riskier market than gold.

(Chart courtesy elliottwave.com. Click on the chart for a larger version)
MoneyWeek
Subscribe to MoneyWeek today and get your first six magazine issues absolutely FREE

Sign up to Money Morning
Don't miss the latest investment and personal finances news, market analysis, plus money-saving tips with our free twice-daily newsletter
Don't miss the latest investment and personal finances news, market analysis, plus money-saving tips with our free twice-daily newsletter
The chart shows the phenomenal rise of silver compared with gold (which has been no slouch).
In my last post, I outlined several reasons why I strongly suspected that the public were being tempted in right as the market was topping out. Many of the classic signs are there.
In a nutshell, the market ran out of powerful buyers at the $50 area, and many longs were trousering their gains as the old 1980 high was hit.
On 1 May, silver plunged from $48 to $42 in a matter of 20 minutes. My last post described the mayhem produced in the trading accounts of the longs that this produced.
Many are calling it the 'Silver Flash Crash' in honour of the 6 May 2010 air pocket in the stock market (this is almost the exact anniversary of that event).
But many novice traders and spread betters believe that in these panics, the market is acting 'irrationally' and there is no discernable pattern.
Nothing could be further from the truth, as I hope to show you.
There's method in silver's madness
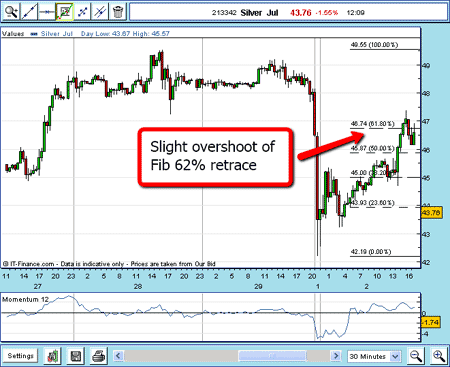
Following up from where the last chart left off, I forecast an A-B-C correction from the low of early 2 May, and that is what we got with the C-wave reaching a Fibonacci 62% retrace of the entire move down from the $50 high

(Click on the chart for a larger version)
The A-B-C pattern is clear and there is a slight over-shoot of the exact Fibonacci 62% level. But what a terrific place to enter short positions! The three-wave rally is typically corrective to the one degree larger trend, which is now down.
Let's step back and consider what has happened. After an avalanche of panic selling, the market is rallying. The buying of the 'buy-the-dippers' and short-covering has overcome the selling of the scared longs and new shorts.
And the rally has occurred in a classic three-wave pattern taking it to an almost exact Fibonacci retrace level. The market is anything but irrational when you see it from this perspective.
There is an inherent order in markets. If you can see this order (using these Elliott waves and Fibonacci concepts) that many others do not see, you have a trading edge.
Now, what has happened since then? Let's have a look at the current chart:
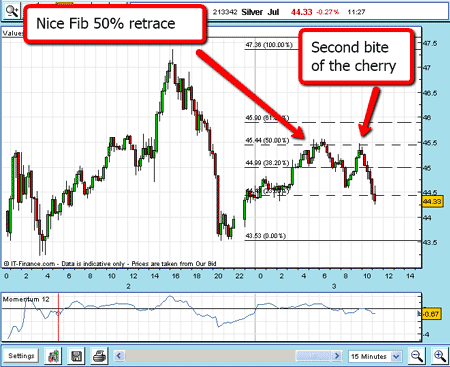
Late on 2 May, the market collapsed again, taking it from $46.80 to the $43.50 area (a drop of 7%), but then staged a rally and where did this rally carry?

(Click on the chart for a larger version)
It carried right to the Fibonacci 50% retrace of the move down late on 2 May!
(I have applied my Fibonacci tool to the high of $47.36 and the low of $43.53)
And then it has plunged again it is challenging the low at $43.50 as I write.
Once again, a Fibonacci retrace (the 50% level) would have been a great place to short. Another case of order in the markets.
I hope I have shown that there are discernable tradable patterns in markets that can be exploited by anyone who can use the Fibonacci tool on their spread betting platform.
I know I have shown only one side of the trading coin how to find good, low-risk entry points. The much more difficult job is finding good exits. That is where many traders come adrift and I shall cover this crucial topic over the space of several future articles.
NB: Don't miss my next trading insight. To receive all my spread betting blog posts by email, as soon as I've written them, just sign up here .
Get the latest financial news, insights and expert analysis from our award-winning MoneyWeek team, to help you understand what really matters when it comes to your finances.
John is is a British-born lapsed PhD physicist, who previously worked for Nasa on the Mars exploration team. He is a former commodity trading advisor with the US Commodities Futures Trading Commission, and worked in a boutique futures house in California in the 1980s.
He was a partner in one of the first futures newsletter advisory services, based in Washington DC, specialising in pork bellies and currencies. John is primarily a chart-reading trader, having cut his trading teeth in the days before PCs.
As well as his work in the financial world, he has launched, run and sold several 'real' businesses producing 'real' products.
-
 Average UK house price reaches £300,000 for first time, Halifax says
While the average house price has topped £300k, regional disparities still remain, Halifax finds.
-
 Barings Emerging Europe trust bounces back from Russia woes
Barings Emerging Europe trust has added the Middle East and Africa to its mandate, delivering a strong recovery, says Max King